3,000 Households: Read the Consumer Confidence Index Before You Buy
2026-09-20
The Consumer Confidence Index (CCI) measures how optimistic or pessimistic households feel about the economy, their finances, and their job prospects. It runs on a scale benchmarked to 1985 = 100, so a reading above 100 means people feel better than they did that year, and a reading below 100 means they feel worse. The number matters because consumer spending drives roughly two-thirds of economic activity, and confidence tends to move before wallets do.
TL;DR:
- Consumer confidence tends to decline several months before a noticeable slowdown in retail sales or employment figures occurs.
- The index’s monthly swings are often driven by short-term headlines and market reactions, so analyzing three to six months of data provides clearer trend signals.
- A high present situation index coupled with weak future expectations can signal an upcoming slowdown, while the opposite may indicate a recovery phase.
- Comparing confidence with objective numbers like inflation or unemployment helps determine if mood shifts are likely to persist or remain temporary.
- The consumer confidence index is relative to the 1985 benchmark, so identical headline scores in different countries or times do not imply the same economic conditions.
Table of Contents
- Consumer Confidence Index Explained: How the Survey Works
- How the Index Is Calculated Against the 1985 Benchmark
- Present Situation vs. Expectations: The Two Subindexes
- Why the CCI Matters for Spending and Markets
- Reading the Noise: How to Interpret Monthly Swings
- Where the Official Numbers Come From
- How Fiatmap Helps You Track the Bigger Picture
- Using the CCI as an Individual: An Editorial Take
- Explore Related Economic Data With Fiatmap
- Primary Sources for Verifying the Numbers
- Sources
- FAQ
Consumer Confidence Index Explained: How the Survey Works
The CCI comes from a monthly survey of about 3,000 U.S. households, each asked five core questions. Two focus on the present, three look ahead six months, and The Conference Board seasonally adjusts the results before publishing them.
The five questions break down like this:
- Current business conditions (good, normal, or bad)
- Current job availability (plentiful, not so plentiful, or hard to get)
- Expected business conditions six months out
- Expected job availability six months out
- Expected household income six months out
Survey design matters more than most readers assume. Because two questions anchor on the present and three on the future, the index leans slightly forward looking by construction. That’s worth remembering any time the headline number swings. It isn’t a poll about how people feel today so much as a blend of today’s reality and tomorrow’s guesswork, weighted toward the guesswork.
How the Index Is Calculated Against the 1985 Benchmark
The math behind the CCI isn’t a simple percentage of happy respondents. Analysts take the share of positive responses and divide it by the sum of positive and negative responses for each question, producing what’s called a relative value. Those relative values then get benchmarked against the average for 1985, which is fixed at 100.
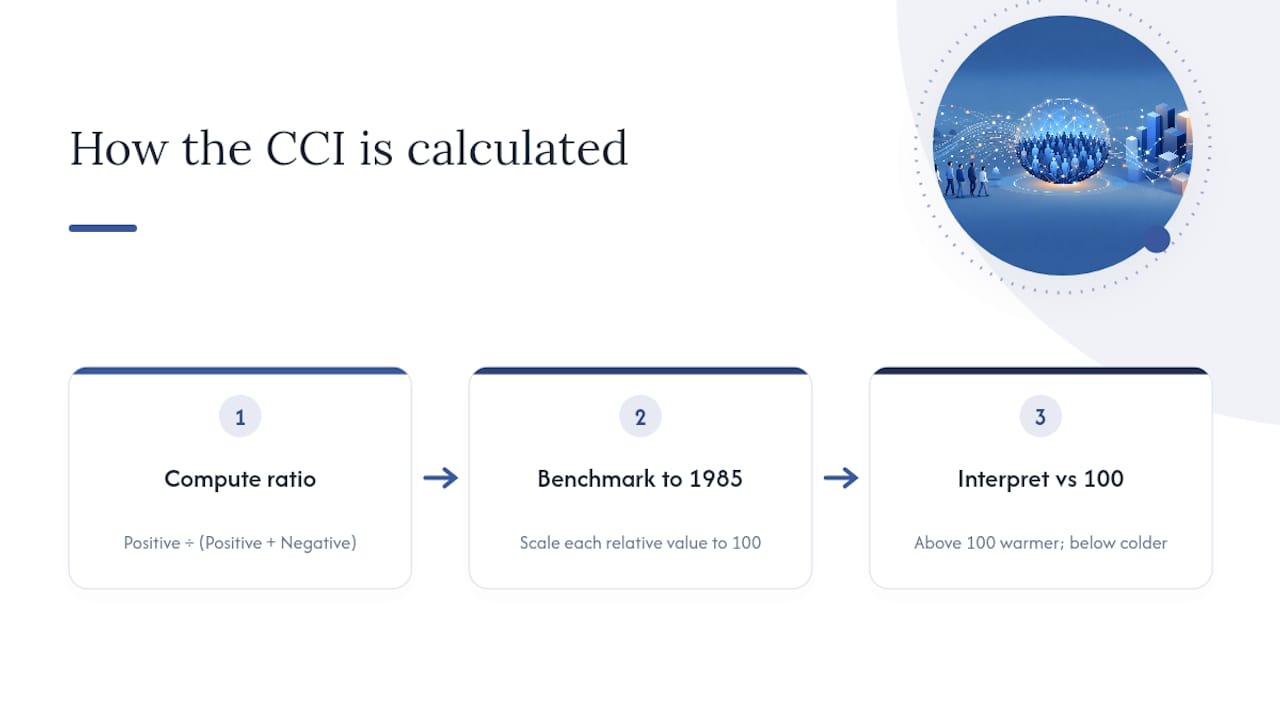
That distinction trips up a lot of readers. A CCI of 95 does not mean 95% of people are confident. There’s no ceiling and no natural floor. The number simply tells you whether the country as a whole is trending warmer or colder relative to that fixed historical point.
This relative structure also explains why comparing the CCI across countries or eras needs care. Two economies can post the identical headline number while facing very different unemployment rates, wage growth, or inflation pressure underneath it.
Present Situation vs. Expectations: The Two Subindexes
The Conference Board splits the CCI into two components that often move in different directions. The Present Situation Index reflects how people rate current business and job conditions. The Expectations Index captures where they think things are headed over the next six months.
Reading the gap between them adds real texture:
- A high Present Situation reading paired with weak Expectations often shows up before a slowdown, since people sense good times but doubt they’ll last.
- The reverse pattern, strong Expectations with a soft Present Situation, can signal recovery sentiment building before the data confirms it.
- When both subindexes move together, the headline number tends to carry more weight as a clean signal.
Why the CCI Matters for Spending and Markets
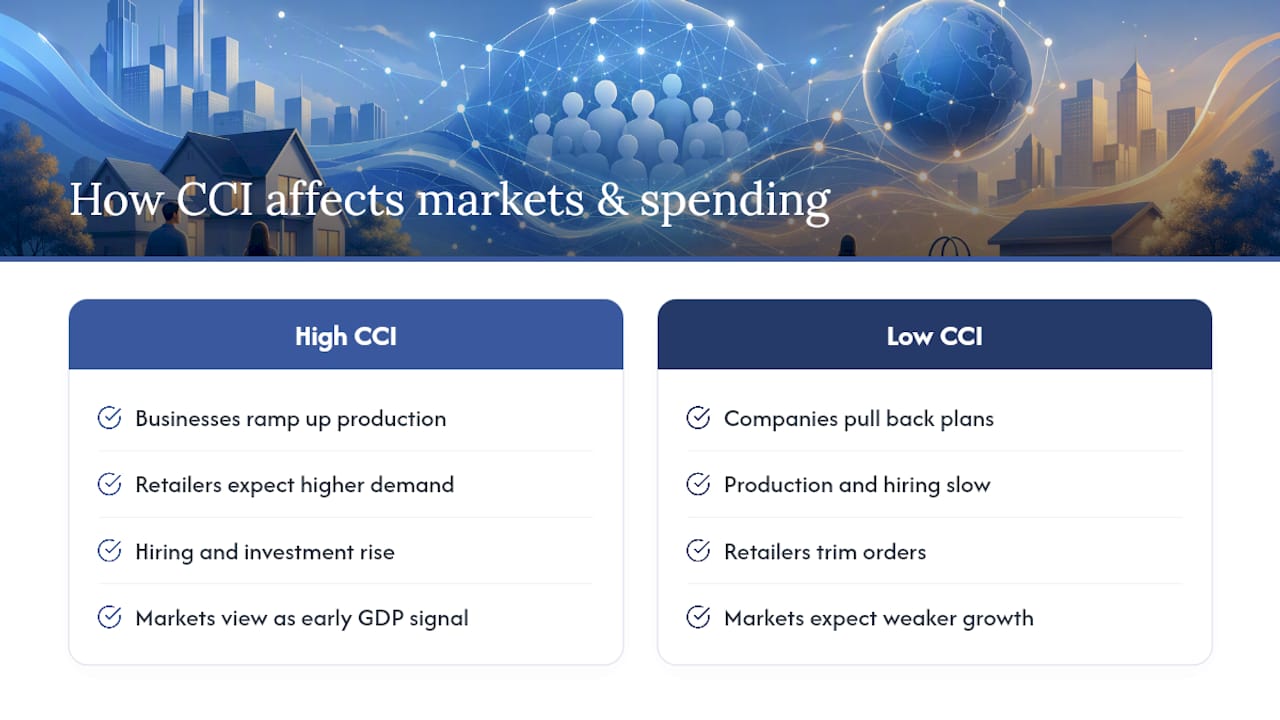
Confident consumers spend, and spending is what keeps businesses hiring and investing. When the CCI climbs, retailers and manufacturers often ramp up production ahead of demand they expect to materialize. When it falls, companies pull back on plans before sales numbers even confirm a slowdown.
Markets watch the release closely for the same reason. The Conference Board publishes the CCI monthly, well ahead of slower-moving official statistics like GDP, so traders and economists treat it as an early read on where harder data might land weeks later.
That said, sentiment isn’t destiny. The CCI reflects how people feel, not necessarily what they’ll actually do with their money. A household can report gloomy expectations and still keep spending out of habit or necessity, or report high confidence and still tighten up if credit gets more expensive. Treat the index as one input among several, not a standalone forecast. Cross-checking it against unemployment trends or GDP growth gives a fuller picture than the headline number alone.
Reading the Noise: How to Interpret Monthly Swings
Consumer confidence surveys react quickly to headlines, gas prices, and stock market dips, which makes month-to-month readings jumpy. A single monthly drop rarely signals a turning point on its own. Analysts at the St. Louis Fed have pointed out that short-term news sensitivity makes the survey volatile, which is exactly why trend watching beats single-point reactions.
The practical rule: look at three to six months of data before drawing any conclusion. One weak reading after a bad news cycle usually means noise. A steady decline over half a year means something real is shifting in how people feel about their finances.
Pro Tip: Pair the CCI trend with hard numbers like the unemployment rate, retail sales, and inflation. If confidence is falling but spending and hiring stay steady, the mood swing probably won’t last.
Where the Official Numbers Come From
Three organizations anchor most CCI-related reporting, and each publishes on its own schedule:
- The Conference Board releases the headline U.S. CCI monthly, typically in the last week of the month.
- The OECD compiles consumer confidence series across member countries, useful for cross-border comparisons.
- The University of Michigan runs a separate consumer sentiment survey with its own methodology, often cited alongside the Conference Board’s number.
Historical series from all three are downloadable directly from their respective sites for anyone who wants to chart trends themselves.
How Fiatmap Helps You Track the Bigger Picture
Fiatmap pulls its data from official statistics, which matters when you’re trying to line up consumer confidence against other macro signals. The platform’s macro glossary breaks down concepts like CPI and unemployment in plain language, so a confidence reading doesn’t sit in isolation from the inflation or job numbers that usually explain it.
If you want to see whether a confidence dip lines up with a real wage squeeze or a housing slowdown, Fiatmap’s country comparison tools let you check that context across 128 countries at once.
Using the CCI as an Individual: An Editorial Take
The CCI is a mood ring, not a crystal ball. It’s genuinely useful for spotting shifts before they show up in official data, but I’d weight your own income trend and local inflation far more heavily than any national confidence reading when deciding on a big purchase. Watch the trend, not the month.
— Torstein
Explore Related Economic Data With Fiatmap
Free access to official economic data across many countries beats piecing together numbers from multiple government sites when you’re trying to understand how confidence, inflation, and mortgage costs connect in your own market.

Data figures trace back to official statistical sources, so you’re not cross-referencing marketing copy dressed up as data. The Global Money Dataset lets you download CSV or JSON files covering inflation, unemployment, GDP growth, and dozens of other series to build your own comparisons against consumer sentiment trends. If you’re weighing a home purchase while confidence readings wobble, the mortgage rate glossary and country rankings are a practical next stop.
Primary Sources for Verifying the Numbers
For the latest official readings, go straight to The Conference Board for U.S. CCI releases, the OECD for international series, and the University of Michigan for its parallel sentiment survey. Always check primary releases before quoting a specific monthly figure.
Sources
- Consumer confidence index - Wikipedia
- Consumer Confidence Surveys: Do They Boost Forecasters’ Confidence? - St. Louis Fed
- Data
- Conference Board release timing context - New York Fed
FAQ
What Is a Good Consumer Confidence Index Reading?
There’s no universal “good” number, since the index is relative to the 1985 benchmark of 100. Readings meaningfully above 100 generally reflect optimism relative to that baseline, while readings below 100 reflect pessimism, and the trend over several months matters more than any single score.
What Does the Consumer Confidence Index Actually Measure?
It measures how households feel about current business and job conditions, plus their expectations for business conditions, jobs, and income over the next six months. The survey covers roughly 3,000 households and gets seasonally adjusted before publication.
What Happens When Consumer Confidence Is Low?
Low confidence typically precedes pullbacks in consumer spending, since worried households save more and delay big purchases. Businesses often respond by slowing hiring or investment plans, which is why economists and markets treat sustained declines as an early warning sign rather than a lagging confirmation.
Where Can I Find the Current Consumer Confidence Index?
The Conference Board publishes the current U.S. figure monthly on its own site, and it’s the primary source for the headline number most media outlets cite. For a complementary read, the University of Michigan’s sentiment survey publishes on its own separate schedule.
Recommended
The figures on this site are collected from official statistics and each carries its own source and date — see /sources and the dataset. Where this article states a number, the country and ranking pages are what it should agree with.