House price growth since 2015
How much have house prices moved there since 2015?
An index, not a price: 2015 = 100, so 167 means prices have risen 67 % since then. It says nothing about what a house costs — a cheaper country can sit far higher than an expensive one. Official sources (Eurostat, Case-Shiller).
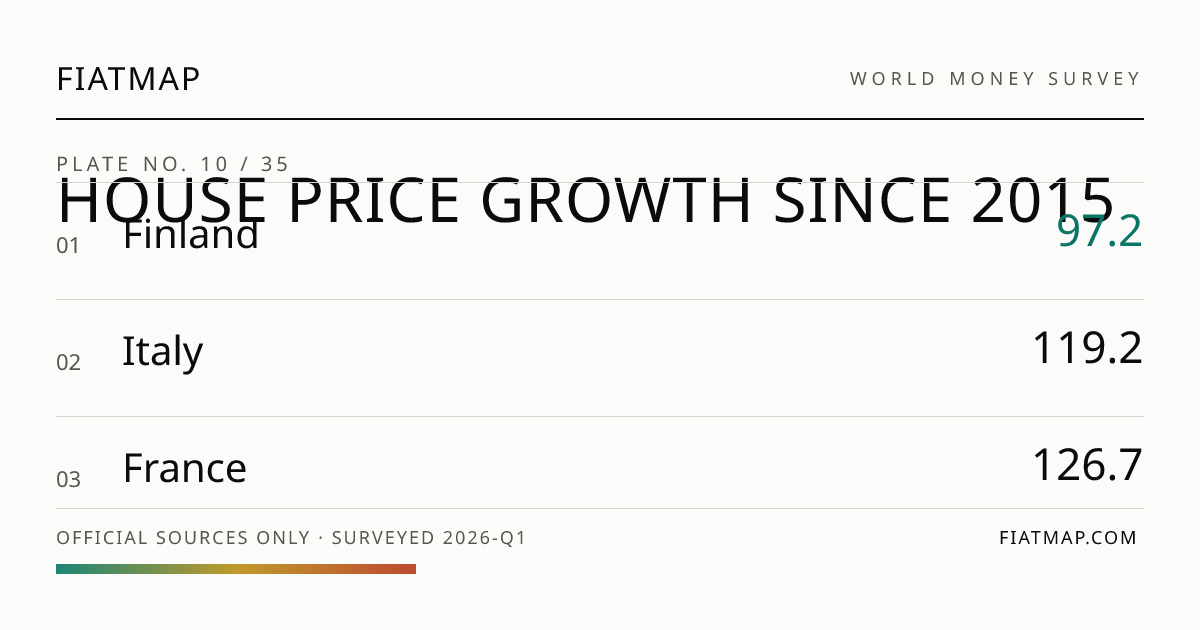
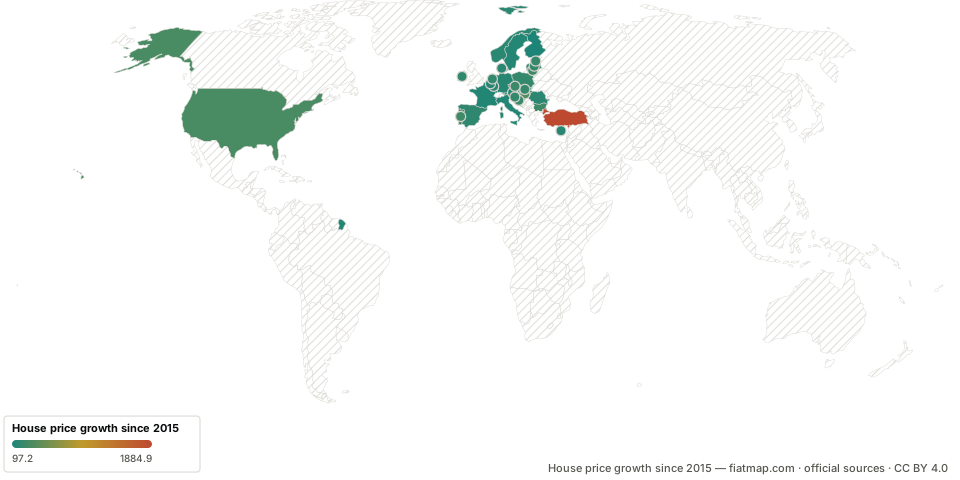
Finland leads with 97.5; Turkey sits last at 1884.9. The index measures movement, not price levels (2015 = 100) — the slowest risers since 2015 come first.
Coverage: 29 of ~28 countries this field can reach — Eurostat + Case-Shiller only (one base year, never mixed)
Free to republish — just credit us
Fiatmap, “House price growth since 2015 by country”, fiatmap.com/rankings/house-prices. Licensed CC BY 4.0. Underlying data: official statistics (BIS, ECB, FRED, Eurostat, OECD, World Bank, SSB), each value dated at source.
Embed this on your own site
Top-10 table (live)
<iframe src="https://fiatmap.com/embed/ranking/house-prices" title="House price growth since 2015 by country — Fiatmap" width="360" height="440" style="border:0" loading="lazy"></iframe>
World map
<iframe src="https://fiatmap.com/embed/map/house-prices" title="House price growth since 2015 by country — Fiatmap" width="720" height="430" style="border:0" loading="lazy"></iframe>
On the map
The full ranking
| 1 | Finland | 97.5 | Q2 2026 | Checked 24 Oct 2026 |
| 2 | Italy | 121.0 | Q2 2026 | Checked 24 Oct 2026 |
| 3 | France | 125.5 | Q2 2026 | Checked 24 Oct 2026 |
| 4 | Sweden | 139.3 | Q2 2026 | Checked 24 Oct 2026 |
| 5 | Belgium | 146.0 | Q2 2026 | Checked 24 Oct 2026 |
| 6 | Germany | 153.5 | Q2 2026 | Checked 24 Oct 2026 |
| 7 | Cyprus | 159.1 | Q2 2026 | Checked 24 Oct 2026 |
| 8 | Denmark | 165.6 | Q2 2026 | Checked 24 Oct 2026 |
| 9 | Luxembourg | 166.4 | Q2 2026 | Checked 24 Oct 2026 |
| 10 | Norway | 170.0 | Q2 2026 | Checked 24 Oct 2026 |
| 11 | Austria | 175.4 | Q2 2026 | Checked 24 Oct 2026 |
| 12 | Romania | 182.0 | Q2 2026 | Checked 24 Oct 2026 |
| 13 | Malta | 183.9 | Q2 2026 | Checked 24 Oct 2026 |
| 14 | Spain | 200.6 | Q2 2026 | Checked 24 Oct 2026 |
| 15 | Ireland | 205.9 | Q2 2026 | Checked 24 Oct 2026 |
| 16 | Netherlands | 222.6 | Q2 2026 | Checked 24 Oct 2026 |
| 17 | Slovakia | 225.9 | Q2 2026 | Checked 24 Oct 2026 |
| 18 | Poland | 229.2 | Q2 2026 | Checked 24 Oct 2026 |
| 19 | Latvia | 233.5 | Q2 2026 | Checked 24 Oct 2026 |
| 20 | Slovenia | 234.2 | Q2 2026 | Checked 24 Oct 2026 |
| 21 | Estonia | 236.7 | Q2 2026 | Checked 24 Oct 2026 |
| 22 | Croatia | 252.6 | Q2 2026 | Checked 24 Oct 2026 |
| 23 | Czech Republic | 263.9 | Q2 2026 | Checked 24 Oct 2026 |
| 24 | Bulgaria | 284.8 | Q2 2026 | Checked 24 Oct 2026 |
| 25 | Lithuania | 291.0 | Q2 2026 | Checked 24 Oct 2026 |
| 26 | Portugal | 301.4 | Q2 2026 | Checked 24 Oct 2026 |
| 27 | United States | 337.3 | July 2026 | Checked 24 Oct 2026 |
| 28 | Hungary | 389.6 | Q2 2026 | Checked 24 Oct 2026 |
| 29 | Turkey | 1884.9 | Q4 2024 | Checked 24 Oct 2026 |
How to read this figure
This is an index, not a price: 2015 = 100, so it tracks how much prices have moved, not what a house costs. It covers the whole country — hot capitals and cooling regions averaged together — and says nothing about absolute levels: a country can be far cheaper than another yet have a higher index because its prices rose faster since 2015. Source: the official house price index (Eurostat for Europe, Case-Shiller for the US).
Countries with the lowest house price growth since 2015 · Countries with the highest house price growth since 2015
How to read this list
An index, not a price: 2015 = 100, so 167 means prices have risen 67 % since then. It says nothing about what a house costs — a cheaper country can sit far higher than an expensive one. Official sources (Eurostat, Case-Shiller). 29 countries publish it; the rest are absent from the list rather than shown as zero. The figures were observed between Q4 2024 and July 2026 — a spread of 21 months — so this compares each country’s latest published number, not one moment in time. Every row carries its own date in the CSV and JSON; use it. Nothing here is estimated or carried forward to fill a gap. This metric is one column of the full dataset.