Currency
Did that currency hold its value against the dollar this year?
The currency’s US-dollar value now vs one year ago — positive means it strengthened. Our calculation from daily ECB reference rates.
Australia leads with 7.88 %; Turkey sits last at -15.29 %. Best-for-you first — higher is better here.
Coverage: 71 of ~30 countries this field can reach — ECB publishes ~30 reference currencies
Free to republish — just credit us
Fiatmap, “Currency by country”, fiatmap.com/rankings/currency. Licensed CC BY 4.0. Underlying data: official statistics (BIS, ECB, FRED, Eurostat, OECD, World Bank, SSB), each value dated at source.
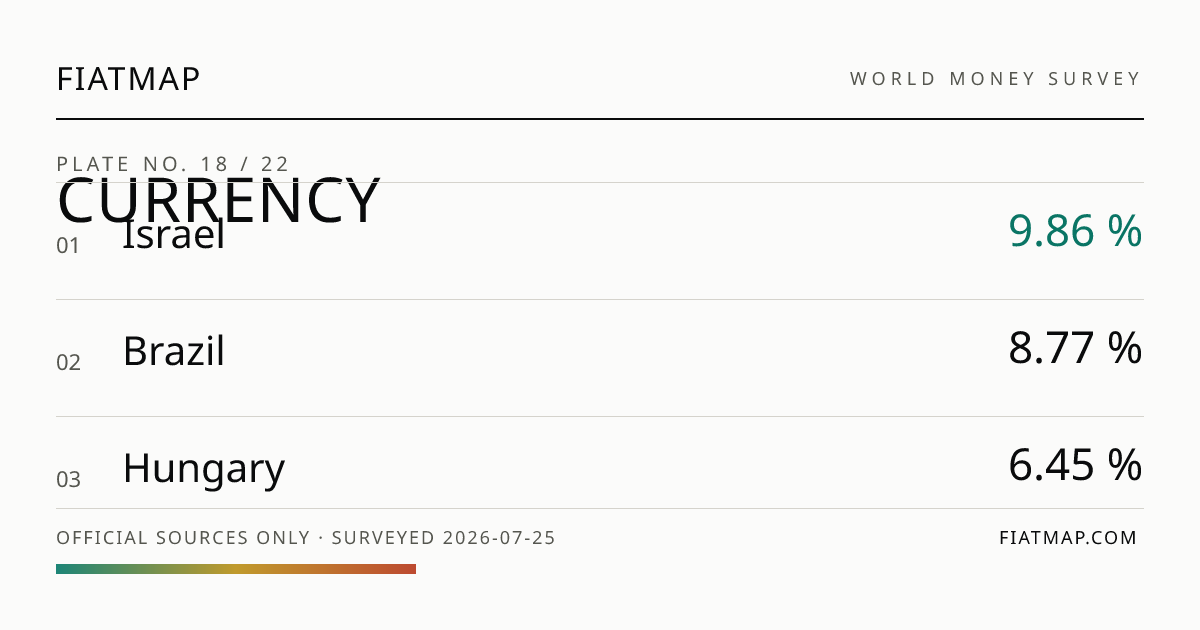
Embed this on your own site
Top-10 table (live)
<iframe src="https://fiatmap.com/embed/ranking/currency" title="Currency by country — Fiatmap" width="360" height="440" style="border:0" loading="lazy"></iframe>
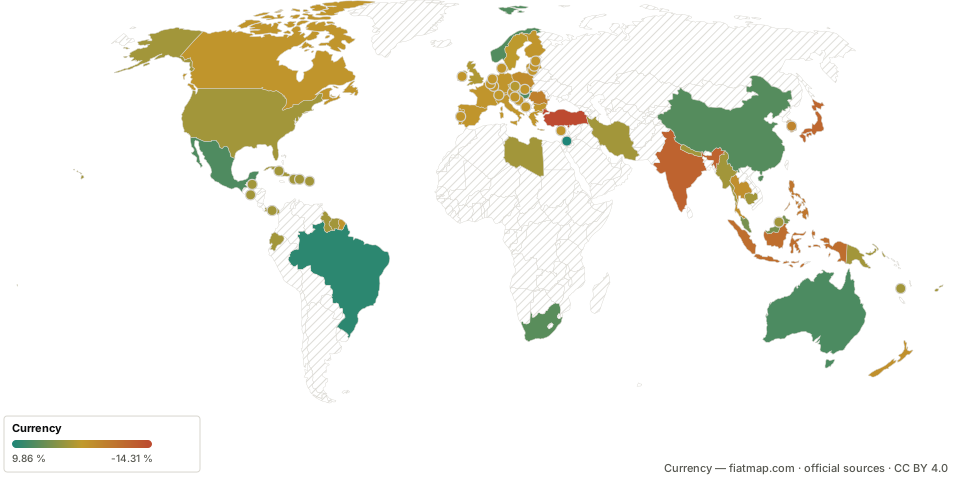
World map
<iframe src="https://fiatmap.com/embed/map/currency" title="Currency by country — Fiatmap" width="720" height="430" style="border:0" loading="lazy"></iframe>
On the map
The full ranking
| 1 | Australia | 7.88 % | October 2026 | Checked 24 Oct 2026 |
| 2 | Norway | 6.93 % | October 2026 | Checked 24 Oct 2026 |
| 3 | China | 6.52 % | October 2026 | Checked 24 Oct 2026 |
| 4 | Israel | 6.38 % | October 2026 | Checked 24 Oct 2026 |
| 5 | South Africa | 5.17 % | October 2026 | Checked 24 Oct 2026 |
| 6 | Mexico | 4.22 % | September 2026 | May be outdated |
| 7 | Malaysia | 3.57 % | October 2026 | Checked 24 Oct 2026 |
| 8 | Brazil | 2.27 % | October 2026 | May be outdated |
| 9 | Singapore | 1.75 % | October 2026 | Checked 24 Oct 2026 |
| 10 | Hungary | 1.67 % | October 2026 | May be outdated |
| 11 | United Kingdom | 0.40 % | October 2026 | Checked 24 Oct 2026 |
| 12 | United States | 0.00 % | October 2026 | Checked 24 Oct 2026 |
| 13 | Dominican Republic | 0.00 % | October 2026 | Checked 24 Oct 2026 |
| 14 | Guyana | 0.00 % | October 2026 | Checked 24 Oct 2026 |
| 15 | Myanmar | 0.00 % | October 2026 | Checked 24 Oct 2026 |
| 16 | Belize | 0.00 % | October 2026 | Checked 24 Oct 2026 |
| 17 | Nepal | 0.00 % | October 2026 | Checked 24 Oct 2026 |
| 18 | Puerto Rico | 0.00 % | October 2026 | Checked 24 Oct 2026 |
| 19 | Suriname | 0.00 % | October 2026 | Checked 24 Oct 2026 |
| 20 | Cambodia | 0.00 % | October 2026 | Checked 24 Oct 2026 |
| 21 | Iran | 0.00 % | October 2026 | Checked 24 Oct 2026 |
| 22 | Libya | 0.00 % | October 2026 | Checked 24 Oct 2026 |
| 23 | Papua New Guinea | 0.00 % | October 2026 | Checked 24 Oct 2026 |
| 24 | Haiti | 0.00 % | October 2026 | Checked 24 Oct 2026 |
| 25 | Fiji | 0.00 % | October 2026 | Checked 24 Oct 2026 |
| 26 | Panama | 0.00 % | October 2026 | Checked 24 Oct 2026 |
| 27 | Brunei | 0.00 % | October 2026 | Checked 24 Oct 2026 |
| 28 | Ecuador | 0.00 % | October 2026 | Checked 24 Oct 2026 |
| 29 | El Salvador | 0.00 % | October 2026 | Checked 24 Oct 2026 |
| 30 | Cuba | 0.00 % | October 2026 | Checked 24 Oct 2026 |
| 31 | Canada | -0.15 % | October 2026 | Checked 24 Oct 2026 |
| 32 | Poland | -0.28 % | August 2026 | May be outdated |
| 33 | Hong Kong | -0.84 % | October 2026 | Checked 24 Oct 2026 |
| 34 | New Zealand | -1.05 % | October 2026 | Checked 24 Oct 2026 |
| 35 | South Korea | -1.64 % | August 2026 | May be outdated |
| 36 | Japan | -2.73 % | October 2026 | Checked 24 Oct 2026 |
| 37 | Thailand | -2.75 % | October 2026 | Checked 24 Oct 2026 |
| 38 | Switzerland | -2.85 % | October 2026 | Checked 24 Oct 2026 |
| 39 | Czech Republic | -3.08 % | October 2026 | Checked 24 Oct 2026 |
| 40 | Finland | -3.25 % | October 2026 | Checked 24 Oct 2026 |
| 41 | Ireland | -3.25 % | October 2026 | Checked 24 Oct 2026 |
| 42 | Netherlands | -3.25 % | October 2026 | Checked 24 Oct 2026 |
| 43 | Italy | -3.25 % | October 2026 | Checked 24 Oct 2026 |
| 44 | Austria | -3.25 % | October 2026 | Checked 24 Oct 2026 |
| 45 | Germany | -3.25 % | October 2026 | Checked 24 Oct 2026 |
| 46 | Latvia | -3.25 % | October 2026 | Checked 24 Oct 2026 |
| 47 | Cyprus | -3.25 % | October 2026 | Checked 24 Oct 2026 |
| 48 | France | -3.25 % | October 2026 | Checked 24 Oct 2026 |
| 49 | Kosovo | -3.25 % | October 2026 | Checked 24 Oct 2026 |
| 50 | Luxembourg | -3.25 % | October 2026 | Checked 24 Oct 2026 |
| 51 | Croatia | -3.25 % | October 2026 | Checked 24 Oct 2026 |
| 52 | Estonia | -3.25 % | October 2026 | Checked 24 Oct 2026 |
| 53 | Slovakia | -3.25 % | October 2026 | Checked 24 Oct 2026 |
| 54 | Greece | -3.25 % | October 2026 | Checked 24 Oct 2026 |
| 55 | Slovenia | -3.25 % | October 2026 | Checked 24 Oct 2026 |
| 56 | Lithuania | -3.25 % | October 2026 | Checked 24 Oct 2026 |
| 57 | Monaco | -3.25 % | October 2026 | Checked 24 Oct 2026 |
| 58 | Malta | -3.25 % | October 2026 | Checked 24 Oct 2026 |
| 59 | Spain | -3.25 % | October 2026 | Checked 24 Oct 2026 |
| 60 | Portugal | -3.25 % | October 2026 | Checked 24 Oct 2026 |
| 61 | Belgium | -3.25 % | October 2026 | Checked 24 Oct 2026 |
| 62 | Montenegro | -3.25 % | October 2026 | Checked 24 Oct 2026 |
| 63 | Andorra | -3.25 % | October 2026 | Checked 24 Oct 2026 |
| 64 | Bulgaria | -3.25 % | October 2026 | Checked 24 Oct 2026 |
| 65 | Denmark | -3.37 % | October 2026 | Checked 24 Oct 2026 |
| 66 | Sweden | -4.96 % | October 2026 | Checked 24 Oct 2026 |
| 67 | India | -7.46 % | October 2026 | Checked 24 Oct 2026 |
| 68 | Philippines | -7.72 % | October 2026 | Checked 24 Oct 2026 |
| 69 | Romania | -8.00 % | October 2026 | Checked 24 Oct 2026 |
| 70 | Indonesia | -8.06 % | October 2026 | Checked 24 Oct 2026 |
| 71 | Turkey | -15.29 % | October 2026 | Checked 24 Oct 2026 |
Regional averages
Europe (34)
-2.79 %
Americas (14)
0.45 %
Asia (17)
-1.66 %
Oceania (4)
1.71 %
Unweighted mean of the published values in each region — our aggregation, not an official statistic.
How to read this figure
Our own calculation from daily ECB reference rates: the currency’s US-dollar value today versus one year ago. A strengthening currency makes imports and foreign travel cheaper; it is not a verdict on the economy.
Countries with the strongest currencies vs the dollar · Countries with the weakest currencies vs the dollar
How to read this list
The currency’s US-dollar value now vs one year ago — positive means it strengthened. Our calculation from daily ECB reference rates. 71 countries publish it; the rest are absent from the list rather than shown as zero. The figures were observed between August 2026 and October 2026 — a spread of 2 months — so this compares each country’s latest published number, not one moment in time. Every row carries its own date in the CSV and JSON; use it. Nothing here is estimated or carried forward to fill a gap. This metric is one column of the full dataset.