Compare Core and Headline Inflation Using Your Country's Data
2026-09-09
Headline inflation measures what people actually pay across the whole basket of goods and services. Core inflation strips out volatile items, commonly food and energy, so economists can see the underlying trend without the noise. Watch headline when you want to know what’s happening to your grocery bill and gas tank right now. Watch core when you want to know where inflation is actually heading.
TL;DR:
- If inflation shocks persist for several months, the divergence between headline and core signals a lasting cost pressure rather than a temporary anomaly.
- When grocery and fuel prices take up a larger share of your expenses, headline inflation more accurately reflects your immediate cost pain.
- A sustained increase in energy prices will eventually appear in core measures, but often with a lag of several months.
- Comparing multiple core variants, such as trimmed mean or median CPI, can provide a more comprehensive view of underlying inflation trends.
- The difference between headline and core inflation varies across countries depending on specific economic factors like energy dependence and housing policies.
Table of Contents
- Core Inflation vs Headline: The Basic Distinction
- What Core Inflation Measures and Why Economists Rely On It
- Headline vs Core Inflation: What the Data Actually Shows
- How Core and Headline Are Actually Calculated
- When Headline Inflation Is the Number to Watch
- Reading a Headline and Core Divergence: A Quick Checklist
- Compare Headline and Core Inflation Across 128 Countries
- A Straight Answer for People Who Just Want to Know Which Number to Trust
- Start Comparing Headline and Core Inflation in Your Own Country
- Sources
Core Inflation vs Headline: The Basic Distinction
Headline inflation is the total, unfiltered number. It covers every category the Consumer Price Index or the Personal Consumption Expenditures index tracks, from rent and haircuts to airline tickets and, yes, eggs. When a news anchor says “inflation hit X percent,” that’s headline. It’s the figure baked into cost-of-living adjustments, wage negotiations, and most public inflation targets.
Core inflation takes that same basket and removes the categories that swing around the most, usually food and energy. The logic is simple: a spike in oil prices or a bad harvest season can push headline inflation up for a few months without reflecting anything structural in the economy. Strip those out, and what’s left is a cleaner read on whether prices are rising because of persistent demand and wage pressure, not because a hurricane knocked out a refinery.
Here’s where headline inflation shows up in everyday financial life:
- Social Security and many pension cost-of-living adjustments are indexed to headline CPI, not core.
- Mortgage and rent negotiations often reference headline figures because they reflect actual out-of-pocket costs.
- Wage bargaining, especially in unionized sectors, frequently cites headline inflation as the benchmark for raises.
- Retailers and suppliers use headline trends to justify price increases passed on to consumers.
Because headline inflation reflects the full basket, it’s also the number that shapes how households actually feel about the economy, even when the underlying trend is calmer than the headline suggests. A single bad month for gas prices can make headline inflation spike while core barely moves, and that gap is often the first sign something temporary, not structural, is going on.
What Core Inflation Measures and Why Economists Rely On It
Core inflation isn’t one fixed formula. The most common version excludes food and energy entirely, but statistical agencies and researchers have built several variants because no single method catches every kind of price distortion.
- Traditional core (ex food and energy): the standard approach used in most U.S. CPI and PCE reporting.
- Trimmed mean: discards the highest and lowest price changes each month, regardless of category, then averages what’s left.
- Median CPI: takes the single category sitting at the midpoint of all price changes that month, ignoring outliers on either end.
- Supercore (or core services excluding housing): strips out goods entirely and focuses on services, a measure the Fed has leaned on more heavily since 2024 to gauge wage-driven inflation.
The appeal of core measures is straightforward: less noise means a clearer signal. Food and energy prices move for reasons that often have nothing to do with the broader economy, weather, geopolitics, OPEC decisions, so pulling them out reveals whether inflation is being driven by something more durable, like rising rents or sticky wage growth.
But core has a real blind spot. If oil prices climb for a sustained stretch, not just a month or two, that’s not noise anymore. It’s a persistent cost pressure that core inflation will miss for months while it works through supply chains and eventually shows up in the price of everything from plastics to airfare. Analysts caution that excluding volatile items entirely risks missing early demand-driven signals, which is exactly why nobody serious treats core as the only number worth watching.
Pro Tip: If core and headline have been diverging for more than two or three consecutive reporting periods, that’s usually a signal the “temporary” shock has stopped being temporary. Check the trend line, not just the latest print.
Headline vs Core Inflation: What the Data Actually Shows
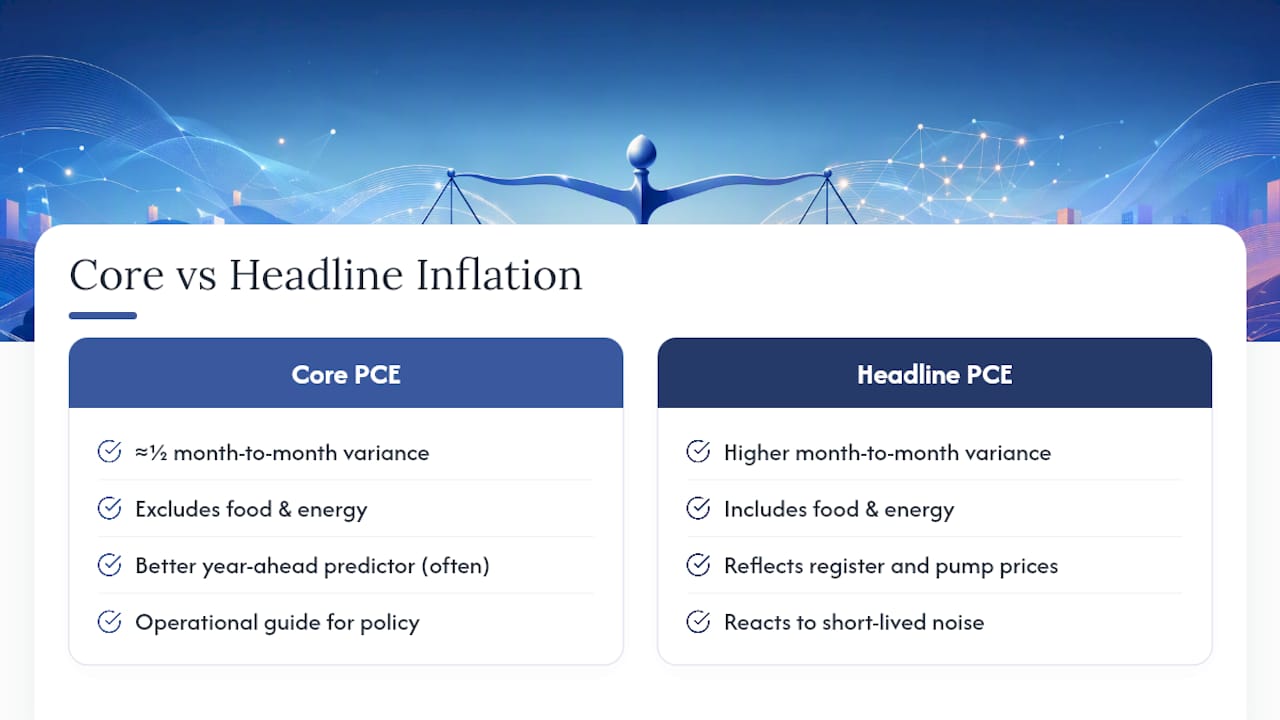
The empirical case for core inflation rests on one simple fact: it moves around a lot less than headline. Research from the St. Louis Fed found that core PCE has carried roughly half the variance of headline PCE over some sample periods, which is a substantial reduction in month-to-month noise. That stability is precisely what makes core useful for spotting a trend rather than reacting to a blip.
Core PCE’s reduced volatility comes at a real cost: food and energy together represent a meaningful share of household spending, with food alone typically making up a moderate share of the PCE basket and energy adding another notable portion.
That’s not a small slice to set aside. When food and energy prices move hard in one direction, core inflation can understate what households are actually experiencing at the register and the pump, even while giving policymakers a more stable trend line to work from.
On predictive power, the record is more nuanced than “core always wins.” The San Francisco Fed’s research on this question concludes that core inflation is often a better predictor of where headline inflation will land a year out than looking at headline alone. But that same research is clear that a full forecast, one that pulls in wage data, import prices, expectations surveys, and multiple core variants, consistently outperforms any single measure, core included.
Central bankers themselves treat core as a tool, not gospel. In a widely cited address, former Fed Governor Frederic Mishkin argued that core inflation serves as an operational guide for monetary policy precisely because it filters out short-lived noise, but he was equally direct that policymakers can’t stop watching headline. If an energy shock lingers long enough, it stops being noise and starts being the story. That tension, between wanting a stable signal and needing to catch real shifts early, is the whole reason this comparison matters in the first place.
How Core and Headline Are Actually Calculated
The mechanics behind these numbers differ more than most explainers admit, and the differences change what the final figure tells you.
CPI vs PCE. The Bureau of Labor Statistics builds the Consumer Price Index from a survey of what urban households directly buy out of pocket. The Bureau of Economic Analysis builds PCE from a broader accounting of all consumption in the economy, including spending done on someone’s behalf, like employer-paid health insurance. That broader scope is one reason the Fed’s preferred inflation gauge, and its official inflation target, is core PCE rather than core CPI.
- CPI uses a fixed basket updated periodically, which can overstate inflation when people substitute cheaper goods for pricier ones.
- PCE uses chain-weighting, adjusting the basket more frequently to reflect actual substitution behavior.
- PCE includes third-party spending (employer and government-paid costs) that CPI excludes entirely.
- The two indices can diverge by half a percentage point or more in a given year purely because of these structural differences, not because inflation itself is different.
Country-specific core definitions. What counts as “core” isn’t universal. The Monetary Authority of Singapore excludes accommodation and private road transport costs from its core measure instead of the standard food-and-energy exclusion. That choice reflects Singapore’s specific economy: housing costs there are shaped heavily by government policy, and car ownership costs are driven by a certificate-of-entitlement system that has little to do with everyday consumer demand. Excluding those categories gives Singaporean policymakers a truer read on the price pressures they can actually influence with monetary policy. It’s a good reminder that “core inflation” is a methodology, not a fixed formula, and it gets adapted to whatever distortions are biggest in a given economy.
When Headline Inflation Is the Number to Watch
Core inflation is the better trend indicator, but there are specific moments when headline deserves your full attention instead.
- Your budget is getting squeezed right now. If gas and groceries are eating a bigger share of your paycheck, headline captures that pain directly. Core won’t, by design.
- You’re negotiating something indexed to inflation. Rent escalation clauses, alimony adjustments, and most cost-of-living raises reference headline CPI, so that’s the figure that actually affects your contract.
- A shock looks like it’s sticking around. A short fuel spike from a refinery outage is noise. A fuel spike that persists for six months because of a sustained supply disruption is a real cost pressure working its way through the economy, and headline will show it first.
- You’re trying to understand a specific price shock’s ripple effects. A sudden supply disruption, like the toilet paper shortage of 2020, shows how a single-category shock can distort headline figures for months while barely denting core, and understanding that gap helps you judge whether a price spike is a supply story or a demand story.
Reading a Headline and Core Divergence: A Quick Checklist
When a new inflation report shows headline and core moving in different directions, don’t just pick a side. Work through it.
- Identify the driver. Which specific components moved, and how much weight do they carry in the overall basket? A 20% jump in a category that’s 1% of the index barely matters; a 5% jump in something that’s 15% of the index matters a lot.
- Judge persistence. Is this a one-time supply disruption (a hurricane, a chip shortage) or something tied to sustained demand, like a tight labor market pushing wages up across services?
- Check the complements. Look at wage growth, import price indexes, and consumer inflation expectations surveys before drawing a conclusion from either number alone.
Pro Tip: Never read one month’s divergence as proof of anything. Look at the trend over at least a full quarter before deciding whether a gap between headline and core is a warning sign or just noise working itself out.
Compare Headline and Core Inflation Across 128 Countries
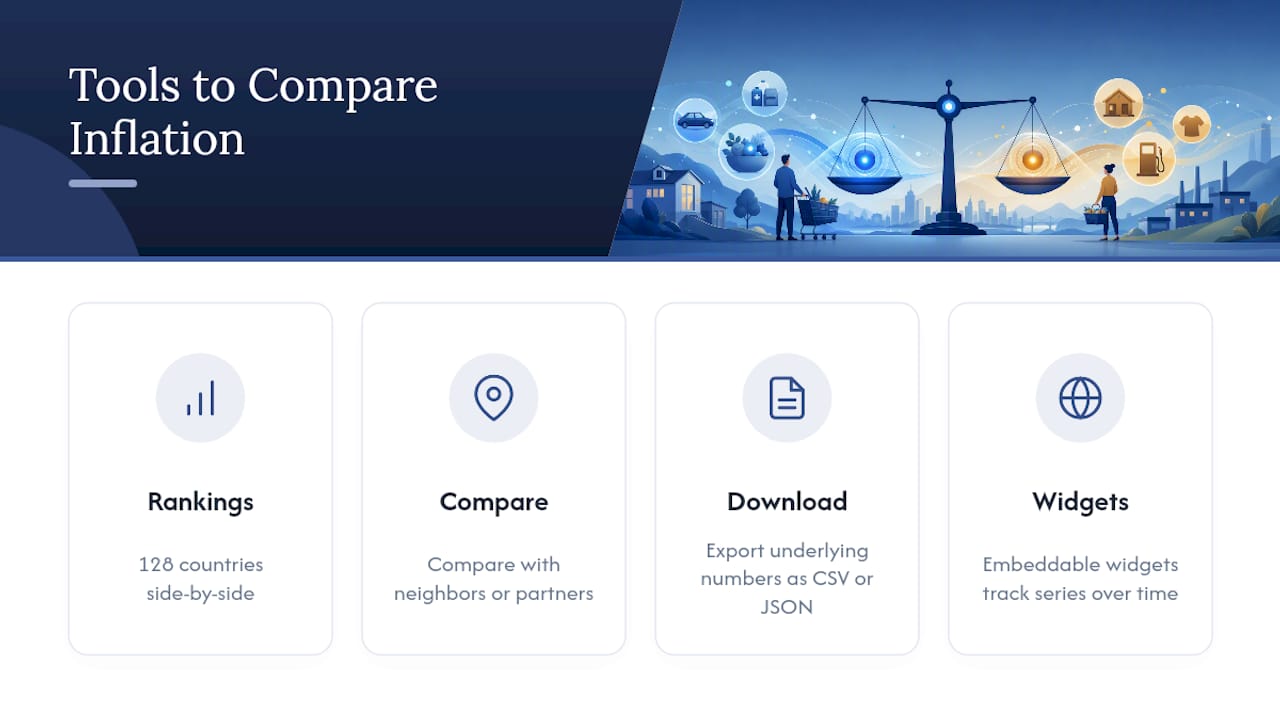
Fiatmap sources every figure it publishes directly from official statistics, and its inflation rankings let you see how headline inflation is actually trending across 128 countries side by side. That’s useful because the gap between headline and core isn’t the same everywhere. A country going through an energy crisis will show a very different headline-core spread than one dealing with a housing shortage.
Practically, you can pull up a country series, compare it against neighbors or trading partners, and download the underlying numbers in CSV or JSON if you want to run your own analysis. The glossary breaks down the terminology if you get stuck on a definition, and the embeddable widgets make it easy to track a specific series over time rather than relying on a single headline number from a news cycle.
A Straight Answer for People Who Just Want to Know Which Number to Trust
If you care about what you’re paying right now, this month, at the pump and the grocery store, watch headline. It’s the number that reflects your actual budget. If you’re trying to figure out where inflation is heading over the next year, or whether a central bank is likely to raise or cut rates, track core instead. It filters out the noise that headline can’t help but include.
Neither number works alone. Use them together, and always ask what’s driving the gap between them before drawing a conclusion. A single monthly report rarely tells the whole story on its own.
— Torstein
Start Comparing Headline and Core Inflation in Your Own Country
Reading about the gap between headline and core is one thing. Seeing it in your own country’s data, over the last five or ten years, is what actually makes the concept click. Inflation series from official statistical agencies across many countries are accessible on some platforms, often without paywalls, allowing users to toggle between headline and core inflation where available and observe how the gap has widened or narrowed over time.

Start with the inflation rankings to see how your country’s headline trend stacks up globally, or head straight to the full dataset if you want to download the raw CSV or JSON and build your own comparison. Every series is sourced, dated, and free to pull, which makes it a straightforward way to test how your personal spending pattern lines up against the official number you keep hearing about on the news.
Sources
- Headline versus Core Inflation in the Conduct of Monetary Policy | Federal Reserve
- What is ‘core inflation,’ and why do economists use it? | San Francisco Fed
- How do we measure inflation? | Monetary Authority of Singapore (MAS)
- CRS background on inflation measures | Congress Research Service
Recommended
The figures on this site are collected from official statistics and each carries its own source and date — see /sources and the dataset. Where this article states a number, the country and ranking pages are what it should agree with.