Export Dependency by Country: Download CSV, Reproduce with Fiatmap
2026-09-19
Export dependency measures how much a country’s economic output relies on selling goods and services abroad, most commonly calculated as exports of goods and services divided by GDP. The headline pattern is consistent across decades: small trade hubs like Singapore and commodity exporters like Angola post the highest ratios, often above 100%, while large diversified economies like the United States and Brazil sit well below 20%.
TL;DR:
- Small trade hubs like Singapore and Hong Kong report export ratios above 100% of GDP due to re-exporting and transit trade, not domestic production.
- Countries with high manufacturing integration, such as South Korea and Mexico, have significantly higher export dependency than large, internal-consumption economies like the United States.
- More than 100 countries are classified as commodity-dependent, with over 60% of their exports consisting of raw commodities, mostly in Africa, Central Asia, and South America.
- Export ratios above 100% are not errors, but reflect gross trade flows that inflate dependence measures for economies built around ports and re-exporting.
- Cross-country comparisons need multiple indicators, including value-added export shares and partner concentration, to accurately assess economic vulnerability.
Table of Contents
- What the Export Dependency Data Actually Shows
- How Do You Define and Measure Export Dependency?
- Which Countries Rank Highest in Export Dependency?
- Why Commodity-Dependent Countries Face Unique Risks
- When Does Export Share of GDP Give a Misleading Picture?
- How to Compare Export Dependency Across Countries
- How Fiatmap Lets You Reproduce These Indicators
- What Analysts Should Prioritize Next
- Download the Data Behind These Numbers
- Sources
- FAQ
What the Export Dependency Data Actually Shows
The global median for exports as a share of GDP hovers in the 25-40% range, though the spread across 128-plus economies tracked by outlets like the World Bank WDI is enormous. Some countries barely clear 10%. Others report figures that look mathematically impossible until you understand the mechanics behind them.
A few reference points make the range concrete:
- Very high (above 100%): Trade hubs and transit economies such as Singapore, Hong Kong, and Luxembourg routinely report exports exceeding total GDP.
- Medium (30-70%): Manufacturing exporters like South Korea and Vietnam, along with many European economies tightly wired into regional supply chains.
- Low (below 20%): Large, internally consumption-driven economies such as the United States, Brazil, and Japan.
Ratios above 100% are not a data error. They happen because exports of goods and services get measured as gross flows, not value added. A container of electronics that passes through Rotterdam or Singapore for repackaging and re-export counts as an export each time it crosses a border, even though the domestic economy only added a sliver of value to it. Small, open economies built around ports, refining, or financial services show this pattern most dramatically.
How Do You Define and Measure Export Dependency?
Exports as a share of GDP is calculated simply: exports of goods and services divided by GDP, expressed as a percentage. Trade openness, a related but broader indicator, adds imports into the equation: (exports + imports) divided by GDP. This second measure captures total trade exposure rather than just the outbound side, which matters when comparing economies with very different import profiles.
Commodity-export dependence is a narrower, more targeted lens. UNCTAD defines a country as commodity-dependent when raw commodities make up 60% or more of its total merchandise exports. That threshold has become the standard cutoff researchers cite when classifying economies as structurally reliant on oil, minerals, or agricultural goods rather than manufactured or service exports.
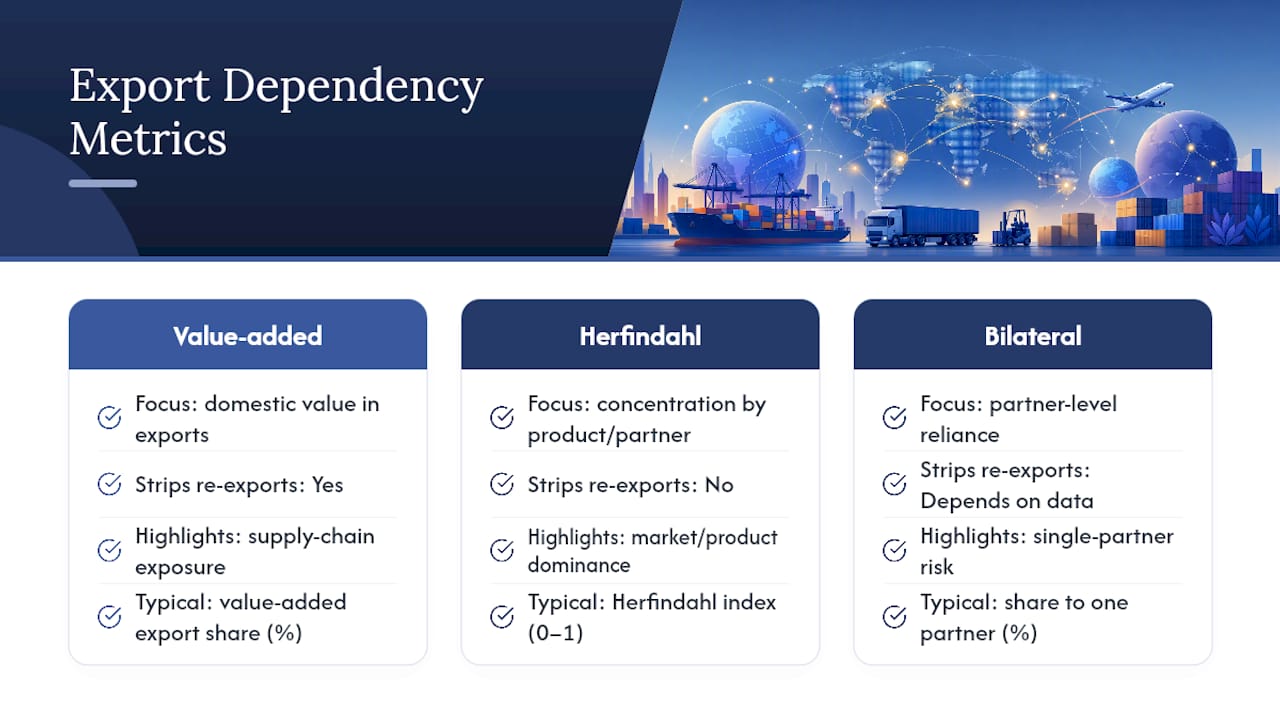
Beyond these headline ratios, analysts increasingly turn to alternative metrics: value-added export shares (which strip out re-exported components), Herfindahl concentration indices (which measure how few products or partners dominate a country’s trade), and bilateral dependency measures that isolate reliance on a single trading partner.
Which Countries Rank Highest in Export Dependency?
Small open economies and dedicated trading hubs dominate the top of any export-dependency ranking, almost by structural design. Hong Kong, Singapore, and Ireland regularly show trade-to-GDP ratios north of 100%, a pattern driven by transit trade, multinational tax structuring, and port economics rather than domestic production scale.
Among major economies, the picture diverges sharply from popular assumptions:
- South Korea posts one of the highest export shares among large economies, a reflection of its deep integration into global electronics and automotive supply chains, as Visual Capitalist’s ranking of major economies shows.
- Mexico ranks high too, largely on the strength of manufacturing tied to North American supply chains.
- The United States sits near the bottom of that same major-economy list, since its enormous domestic consumer market absorbs most output internally.
Regionally, Asia’s export-oriented manufacturing economies and Europe’s tightly integrated single market both skew toward higher dependency scores. Africa and parts of the Americas show a different driver entirely: commodity concentration rather than manufacturing integration, which changes the risk profile even when the headline percentage looks similar.
Why Commodity-Dependent Countries Face Unique Risks
Commodity dependence is far more widespread than most researchers assume. UNCTAD’s most recent assessment finds that more than 100 countries meet the 60% commodity-export threshold, and that this classification has proven remarkably persistent across decades rather than fading as economies mature.
The regional concentration is stark. Sub-Saharan Africa and Central Asia show the heaviest reliance on commodity exports, often split between energy products (oil and gas exporters across the Gulf and parts of Africa) and agricultural or mineral goods (much of South America and West Africa). This matters for a simple reason: commodity prices swing far more violently than manufactured goods prices, so a country earning most of its foreign currency from a single crop or mineral absorbs the full force of global price shocks with little buffer.
Diversification away from a narrow commodity base is one of the most consistently recommended policy responses, precisely because concentrated export baskets transmit external volatility directly into domestic budgets, currency values, and employment.
When Does Export Share of GDP Give a Misleading Picture?
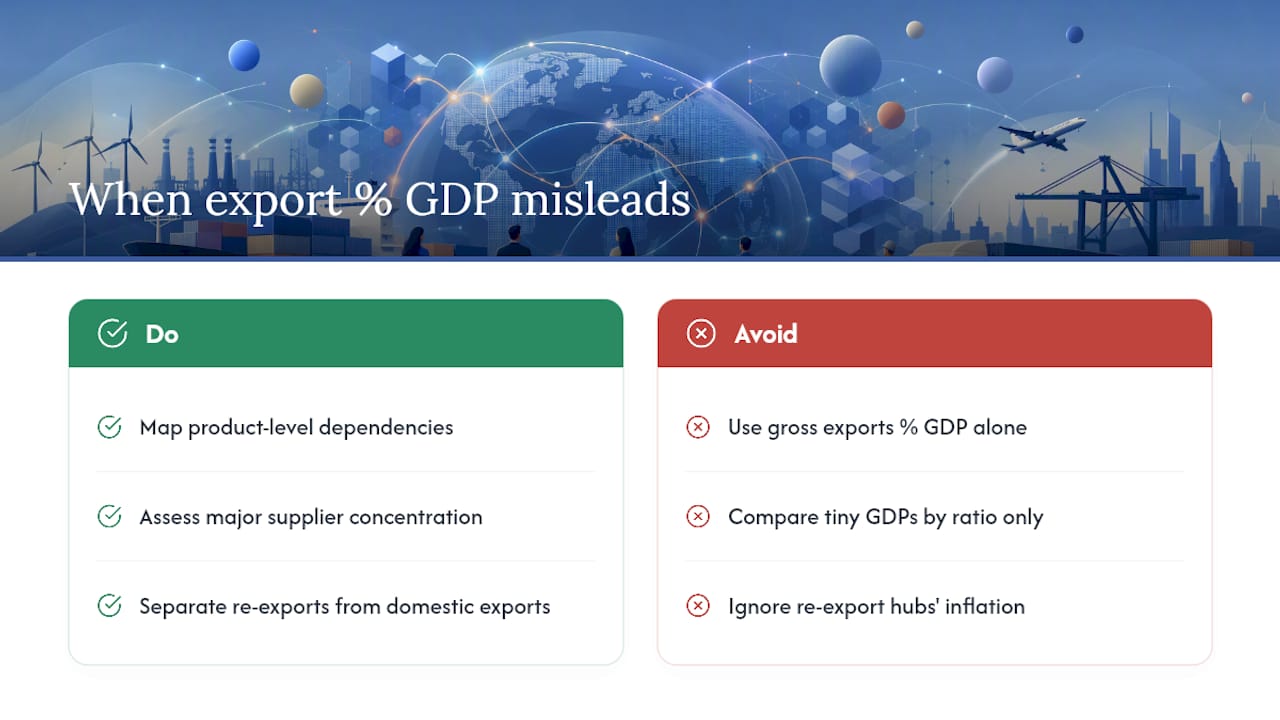
The most common mistake researchers make is treating exports as a percentage of GDP as a clean measure of “how important trade is” to a country, when it actually measures gross trade turnover. Re-export hubs inflate this number without reflecting genuine domestic economic reliance on trade.
Small economies distort comparisons in a second way: any country with a tiny GDP denominator will show volatile, exaggerated percentage swings from a single large contract, port expansion, or oil discovery. A shift that barely registers in a $25 trillion economy can double the ratio in a $30 billion one.
OECD research on trade dependencies makes a compelling case that aggregate ratios miss the vulnerability that actually matters: reliance on specific strategic products from specific partners. A country can look moderately “trade dependent” overall while facing severe exposure on one critical input, semiconductors or fertilizer, sourced almost entirely from a single supplier nation. When that is the concern, gross exports % GDP is the wrong tool; bilateral, product-level dependency mapping is the right one.
How to Compare Export Dependency Across Countries
Building a defensible cross-country comparison takes more than pulling one indicator and sorting a spreadsheet. A reproducible approach looks like this:
- Select indicators and years. Pull exports % GDP and trade openness for the same calendar year across every country in the comparison set.
- Normalize by economic scale. Cross-reference with GDP per capita or income group, since raw percentages mean something different in a $2,000-per-capita economy versus a $60,000-per-capita one.
- Check commodity share and partner concentration. Layer in the UNCTAD 60% threshold test and a partner-concentration check using product-level data from WITS TradeStat or UN Comtrade.
- Visualize as a time series, not a single snapshot. A one-year spike or dip often reflects a commodity price swing rather than a structural change.
The metrics worth tracking side by side: exports % GDP, trade openness, commodity-export share, and a Herfindahl concentration score on either products or partners.
Pro Tip: Never rely on exports % GDP alone for a vulnerability argument. Cross-check it against value-added export shares and partner concentration. A country can look safely diversified on the headline number while depending on a single buyer for 40% export revenue of its actual export revenue.
How Fiatmap Lets You Reproduce These Indicators
Economic datasets exclusively draw from official statistics, covering a broad set of countries across many macroeconomic metrics. Researchers can pull exports and GDP figures side by side, generate a comparison map, or export the underlying numbers directly to CSV or JSON for further modeling in a script or spreadsheet.
Pro Tip: If you’re building a recurring report, embed a live macro card from Fiatmap’s widget library instead of screenshotting a chart. The embedded version updates automatically as new official data lands.
What Analysts Should Prioritize Next
The aggregate export-to-GDP ratio is a starting point, not an endpoint. If your time is limited, spend it on two things: mapping a country’s top three trading partners by product category, and stress-testing how sensitive its export basket is to a 20% commodity price swing. Those two exercises reveal more about real vulnerability than another decimal point on the headline percentage ever will.
— Torstein
Download the Data Behind These Numbers
Building your own export-dependency comparison from scratch means juggling World Bank CSVs, UNCTAD PDFs, and Comtrade queries across different formats and update schedules. Official statistics for many countries are consolidated into one interface, combining exports, GDP, and related macro indicators into a single sourced dataset for comparison.

You can pull the figures behind any chart in this piece and extend them into your own analysis. Head to the Fiatmap Global Money Dataset to download the full CSV or JSON export, or embed a live country-comparison widget directly into your own report. If you’re normalizing export dependency against economic scale, the GDP per capita rankings are a natural next stop.
Sources
- Exports of goods and services (% of GDP) — World Bank WDI
- The State of Commodity Dependence 2025 — UNCTAD
- Towards demystifying trade dependencies — OECD
FAQ
What Is Export Dependency by Country?
Export dependency by country measures how much a nation’s economic output relies on foreign sales, typically calculated as exports of goods and services divided by GDP. High figures cluster among small trade hubs and commodity exporters, while large diversified economies typically show lower ratios, as World Bank WDI data confirms.
Why Do Some Countries Show Exports Above 100% of GDP?
This happens because exports are measured as gross flows through the economy, not domestic value added. Trade hubs like Singapore and Hong Kong report ratios above 100% largely due to re-export and transit trade rather than local production scale.
What Counts as a Commodity-Dependent Country?
A country qualifies as commodity-dependent when raw commodities make up 60% or more of its total merchandise exports, the threshold set by UNCTAD. More than 100 countries currently meet this classification, concentrated heavily in Sub-Saharan Africa, Central Asia, and parts of South America.
How Is Trade Openness Different From Export Dependency?
Trade openness adds imports into the equation, calculated as (exports plus imports) divided by GDP, while export dependency looks only at the outbound side.
Recommended
The figures on this site are collected from official statistics and each carries its own source and date — see /sources and the dataset. Where this article states a number, the country and ranking pages are what it should agree with.