Top 10 Foreign Reserves by Country, Reconciled and Downloadable
2026-09-14
China holds the largest official foreign reserves in the world, with Japan, Switzerland, India, and Russia rounding out the next tier. The exact figures shift depending on the reporting date and on whether gold counts toward the total, but the ranking itself has stayed remarkably stable for over a decade. The full top 10 and the sourcing behind each number are below.
TL;DR:
- Asian countries, led by China, hold the majority of the world’s official foreign reserves, with reserves for the top three countries widening over the past five years.
- The United States has relatively small official reserves because its dollar liquidity needs are different, and it relies less on FX buffers.
- Gold holdings can significantly alter a country’s reserve ranking, with some nations including gold in their totals while others do not, affecting comparability.
- Russia’s reported reserves are uncertain due to asset freezes and sanctions, making actual available reserves lower than official figures suggest.
- Differences among data sources and reporting methods mean analysts should verify reserve figures through central banks, IMF, or World Bank data, considering currency and gold inclusion.
Table of Contents
- Foreign Reserves by Country: Top 10 Ranked
- Where Do These Numbers Actually Come From?
- What Currencies Make Up Global Reserves?
- How Should You Read a Country’s Reserve Total?
- Methodology: How These Figures Are Compiled
- Where to Pull the Raw Data Yourself
- What the Reserve Rankings Actually Tell You
- Sources
- FAQ
Foreign Reserves by Country: Top 10 Ranked
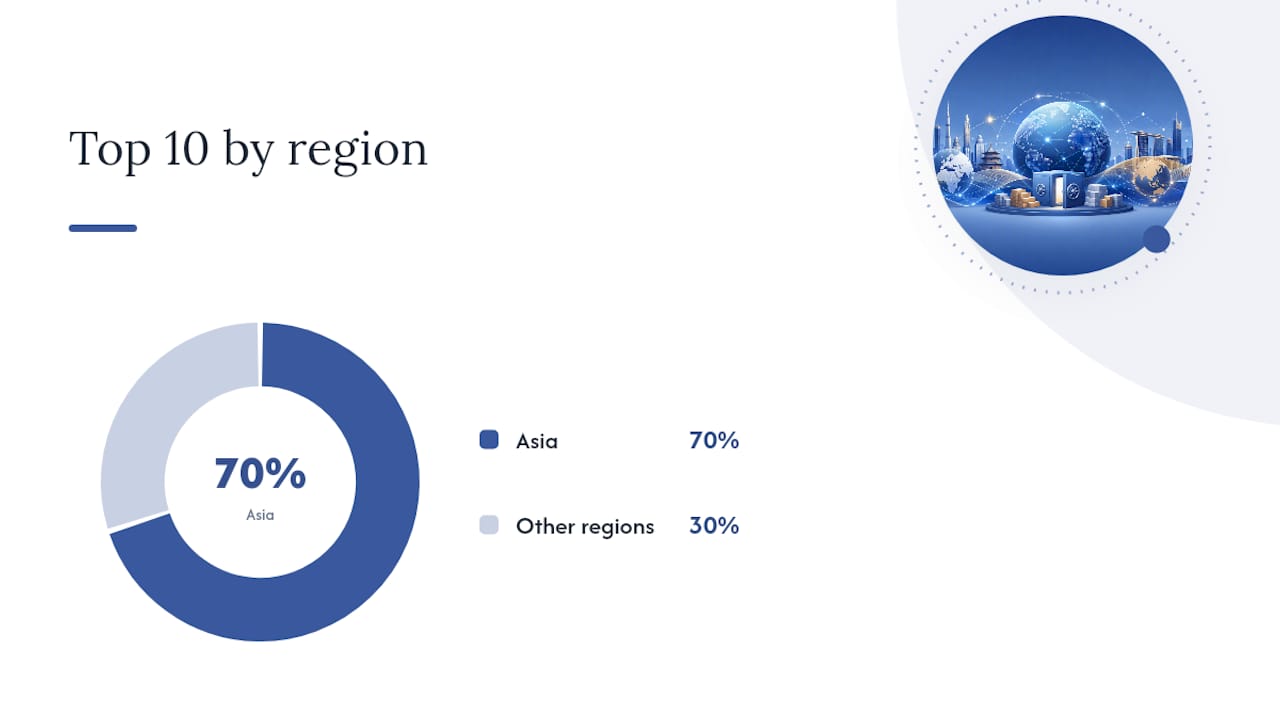
The countries with the biggest reserve stockpiles are concentrated almost entirely in Asia, a pattern that traces back to export-driven growth models and decades of currency-market intervention. China’s holdings alone dwarf most of Europe’s combined reserves, and the gap between the top three and everyone else has widened rather than narrowed over the past five years.
For exact dollar figures and the full country list beyond the top 10, the World Bank’s total reserves indicator and its downloadable country tables give you the raw numbers without the aggregation.
A few things jump out once you look past the raw ranking:
- Asia dominates the top tier. Seven of the top 10 reserve holders sit in Asia, a concentration VisualCapitalist’s analysis attributes to decades of export-led growth and active foreign exchange intervention by central banks trying to manage their currencies.
- The United States is a notable outlier. Despite issuing the world’s dominant reserve currency, the U.S. carries comparatively small official reserves. The Federal Reserve doesn’t need a large FX buffer the way emerging economies do, since dollar liquidity is rarely the problem for Washington.
- Gold inclusion moves the needle for some countries. Nations with large monetary gold holdings can rank differently depending on whether you use a reserves figure that counts gold or one that strips it out. That distinction alone can shuffle a handful of positions in the middle of the list.
- Russia’s figures come with an asterisk. Reported reserve totals for Russia don’t necessarily reflect what’s usable, given the freezing of a large share of its central bank assets abroad since 2022.
If you want to track how these figures shift quarter to quarter, an interactive resource like Fiatmap’s global money map lets you compare reserve-adjacent indicators across countries without digging through separate national releases.
Where Do These Numbers Actually Come From?
Three different institutions publish reserve data, and they don’t always agree, which trips up a lot of people trying to build a clean comparison.
The IMF’s International Reserves and Foreign Currency Liquidity (IRFCL) dataset, along with the broader International Financial Statistics (IFS) database, tracks reserve assets country by country over time, including breakdowns of what’s held in foreign currency, gold, Special Drawing Rights (SDRs), and IMF reserve positions. This is the closest thing to a primary source for time-series analysis.
COFER (Currency Composition of Official Foreign Exchange Reserves) is a different animal entirely. It doesn’t rank countries. It aggregates the currency composition of reserves globally and among “allocated” reporters, showing you what share of world reserves sits in dollars versus euros versus yen. You cannot use COFER to find “how much does Brazil hold.” You use it to understand what currencies the world’s reserves are denominated in.
The World Bank’s Total Reserves indicator (FI.RES.TOTL.CD) pulls together a clean, downloadable, country-by-country total that includes gold, making it the easiest single source for a full cross-country comparison table. It updates on the World Bank’s own schedule rather than in real time, so figures can lag central bank releases by a quarter or more.
Then there’s the noise layer: aggregator sites like Wikipedia’s list of countries by foreign exchange reserves compile figures from multiple sources into one convenient table. These are genuinely useful for a quick cross-check, but they mix reporting dates and sometimes mix gold-inclusive and gold-exclusive figures within the same table. Treat them as a starting point, not the final word.
Here’s how to reconcile the differences when the numbers don’t match:
- Check the reporting date first. A figure from January and a figure from June for the same country can differ by tens of billions of dollars simply due to currency valuation swings, not actual reserve changes.
- Confirm whether gold is included. The World Bank’s headline indicator includes gold at market value; some central bank press releases report FX-only figures that exclude it entirely.
- Match the conversion methodology. Reserves held in euros, yen, or other currencies get converted to U.S. dollars at end-period market exchange rates. A strong dollar quarter can shrink everyone’s dollar-equivalent totals even if their actual holdings didn’t change.
- Go to the national central bank when precision matters. IMF and World Bank data get revised and republished on a lag; a country’s own central bank release is usually the freshest and most authoritative figure for that specific country.
For programmatic access, both the IMF and World Bank offer downloadable CSVs and APIs through the World Bank’s data catalog, which is the fastest route if you want to build your own tracker instead of pulling numbers manually every quarter.
What Currencies Make Up Global Reserves?
COFER tracks eight main reserve currencies: the U.S. dollar, euro, Chinese renminbi, Japanese yen, British pound, Australian dollar, Canadian dollar, and Swiss franc. The dollar still dominates the composition, though its share has drifted down gradually over the past two decades as central banks diversify into other currencies.
A meaningful technical change landed in late 2025: the IMF eliminated the “unallocated” portion of COFER reporting starting in the third quarter of 2025, a category that previously covered reserves whose currency composition wasn’t disclosed. That change means analysts now get a fuller picture of currency composition than in prior years, since a chunk of global reserves that used to sit in an opaque “unallocated” bucket now shows up with an imputed currency breakdown instead.
Pro Tip: Don’t treat a rising renminbi share in COFER as proof that the dollar is losing its dominant role overnight. The shift has been gradual over 20 years, and COFER reporting is voluntary, so country-level composition stays confidential even as global totals get published.
A few things worth knowing about how COFER works in practice:
- COFER data comes from voluntary reporting, so individual country breakdowns are never disclosed publicly, only the aggregate global shares.
- A central bank holding a heavier share of a single currency carries more exposure risk if that currency moves sharply, and less flexibility if it needs to intervene in a currency it holds less of.
- The 2025Q3 change toward fuller allocation transparency makes year-over-year currency composition comparisons more reliable than they were under the older reporting standard.
How Should You Read a Country’s Reserve Total?
A headline reserve figure tells you less than it appears to. The first distinction worth understanding: “official international reserves” and “foreign exchange reserves” aren’t quite the same thing. International reserves include foreign currency assets, gold, SDRs, and a country’s reserve position at the IMF. Foreign exchange reserves technically refer to the currency and currency-denominated securities portion alone. Most published rankings blend these together, which is fine for a rough comparison but matters if you’re trying to understand what a central bank could actually deploy in a crisis.
Reserves also aren’t uniformly liquid. Think of them in tiers: cash and short-term bank deposits sit at the top, ready to move within days. Short-term government securities come next, still liquid but requiring a sale. Longer-dated bonds take more time to unwind without moving the market against you. Gold and SDRs sit at the bottom of the liquidity ladder, technically valuable but slower and sometimes legally or logistically harder to convert quickly.
That distinction becomes critical during an actual crisis. Research on reserve accessibility points out that some reserve assets can be functionally inaccessible when a country needs them most, whether due to legal freezes, sanctions, or market disruptions that make a quick sale impractical without a steep discount.
A few caveats worth holding onto whenever you see a big reserve number in a headline:
- Sanctions can freeze reserves outright. A large share of Russia’s reported reserves became inaccessible after Western sanctions froze central bank assets held abroad, which means the headline total overstates what Moscow can actually use.
- Valuation swings distort comparisons. A stronger dollar mechanically shrinks the dollar value of reserves held in other currencies, even with zero change in actual holdings.
- Country-level currency composition stays confidential. You can see the world’s aggregate currency shares through COFER, but not which currencies any single country holds.
- Gold’s market value moves independently of policy. A gold price rally can inflate a country’s reported reserves without the central bank buying a single additional ounce.
Methodology: How These Figures Are Compiled
Every figure in this article converts to U.S. dollars using end-period market exchange rates, the standard convention both the IMF and World Bank use for cross-country comparison. That means a reserve total reflects both the actual quantity of assets held and the exchange rate on the specific date of reporting, which is exactly why the same country’s reserves can look different across two sources published a month apart.
Sourcing follows a clear hierarchy depending on what’s being shown. Currency composition comes from IMF COFER, since it’s the only dataset that tracks the global currency breakdown of reserves. Full cross-country total rankings come from the World Bank’s Total Reserves indicator, since it offers the cleanest downloadable format across the largest number of countries. Country-specific figures, like the U.S. total, draw from that country’s own central bank release when available, since central banks publish their own numbers faster than international aggregators can process them.
A quick reference on cadence and access:
- IMF IRFCL/IFS updates monthly for most reporting countries, with a typical lag of four to eight weeks.
- COFER publishes quarterly, with the most recent structural change (dropping the unallocated category) taking effect in Q3 2025.
- World Bank totals refresh annually for the full cross-country table, though the underlying monthly data updates more frequently.
- Central bank releases, like the Federal Reserve’s international summary statistics, tend to be the fastest source for a single country’s current figure.
- Programmatic access to all three exists through CSV downloads and REST APIs, letting you build a live tracker instead of checking each site manually.
Where to Pull the Raw Data Yourself
If you want to go past the summarized rankings, four sources cover almost everything you’d need. IMF COFER is the place for currency composition. IMF IRFCL/IFS covers detailed time series by country. The World Bank’s total reserves indicator gives you the cleanest cross-country totals with CSV and API access. Central bank pages, like the Federal Reserve’s international summary, give you the fastest single-country number. For a quick visual sanity check against the rankings above, VisualCapitalist’s compiled ranking is worth a look, and Fiatmap’s downloadable global money dataset offers a sourced, reproducible alternative if you’d rather work with a dataset built specifically for cross-country comparison from the start.
What the Reserve Rankings Actually Tell You
Most coverage of foreign reserves treats the ranking itself as the story: China’s on top, the U.S. is surprisingly low, case closed. That framing misses the more useful question, which is what these reserves are actually for. A country holding reserves equal to a year of import cover is in a fundamentally different position than one holding the same nominal dollar amount but facing sanctions risk or currency mismatch.
The conventional advice, “bigger reserves mean more stability,” breaks down the moment you factor in accessibility. Russia’s case makes this concrete: a large reported total meant little once a meaningful share got frozen. If you’re evaluating a country’s financial resilience, composition and liquidity tiers matter more than the topline figure.
What should you prioritize first? Go to the primary source for the specific claim you’re checking, not an aggregator. Use COFER for currency exposure questions, the World Bank for a cross-country snapshot, and a central bank release when you need the freshest single number. The gap between headline reserves and usable reserves is where most casual analysis goes wrong, and it’s the one distinction worth remembering every time you see a ranking like this one.
— Torstein
Sources
- IMF COFER (Currency Composition of Official Foreign Exchange Reserves)
- Total reserves (includes gold, current US$) | Data
- The Fed - U.S. reserve assets
- CFM Discussion Paper on reserve accessibility (LSE)
FAQ
Which Country Has the Highest Foreign Reserves?
China holds the largest official foreign reserves in the world, with Japan and Switzerland following in the next two spots. Exact figures vary by reporting date and whether gold is included in the total.
How Much in Foreign Reserves Does the United States Hold?
The United States holds comparatively modest official reserves relative to its economy, a figure the Federal Reserve publishes regularly in its international summary statistics. This is smaller than several Asian economies despite the dollar’s dominant global role.
What Are the Top Reserve Currencies Tracked by COFER?
IMF COFER tracks eight main reserve currencies: the U.S. dollar, euro, Chinese renminbi, Japanese yen, British pound, Australian dollar, Canadian dollar, and Swiss franc. The dollar remains the largest single share, though it has gradually declined over the past two decades.
What Is the World’s Dominant Reserve Currency in 2026?
The U.S. dollar remains the world’s dominant reserve currency by share of global holdings, according to IMF COFER data. The euro holds the second-largest share, with the Chinese renminbi still a distant contender despite years of gradual growth.
Does a Country’s Reserve Total Include Gold?
It depends on the source. The World Bank’s headline Total Reserves indicator includes gold at market value, while some central bank releases report foreign exchange holdings separately from gold.
Recommended
The figures on this site are collected from official statistics and each carries its own source and date — see /sources and the dataset. Where this article states a number, the country and ranking pages are what it should agree with.