Use PPPs, AIC and PLIs to Compare GDP and Cost of Living
2026-09-21
GDP measures how much a country produces, not how far a paycheck stretches. If you want to know whether people actually live better in one place than another, skip nominal GDP and look at PPP-adjusted GDP per capita or actual individual consumption (AIC) alongside a real price-level index. The OECD publishes the first, and the World Bank tracks the second through its International Comparison Program.
TL;DR:
- PPP-adjusted GDP per capita and actual individual consumption provide a more accurate measure of living standards than nominal GDP, especially when comparing countries.
- Price level indices reveal how expensive a basket of goods truly costs in different countries, correcting distortions caused by exchange rate conversions.
- High GDP from public spending or capital income does not necessarily translate to higher household disposable income or well-being.
- Income inequality, unpaid work, and environmental quality are significant factors that GDP metrics often overlook.
- When comparing countries, always verify if the GDP figure is PPP-adjusted, examine median incomes or AIC, and confirm with a price level index for an accurate assessment.
Table of Contents
- What GDP Actually Measures (And What It Leaves Out)
- What Cost-of-Living Indexes Actually Track
- Why GDP Per Capita and Real Living Standards Diverge
- How to Compare Living Standards Across Countries Correctly
- Which Number Should You Actually Use?
- Fiatmap’s Data for Comparing GDP and Cost of Living
- Don’t Trust a GDP Headline Until You’ve Checked These Three Things
- Where to Verify These Numbers Yourself
- Sources
- FAQ
What GDP Actually Measures (And What It Leaves Out)
Gross domestic product adds up everything a country produces in a year: goods, services, government spending, exports. Divide that by population and you get GDP per capita, a rough stand-in for average output per person. Economists then split it into nominal GDP (measured in current prices) and real GDP (adjusted for inflation over time), which matters when you’re comparing a country’s own growth across years rather than against another country.
None of that tells you what daily life feels like. GDP was built to measure production, not welfare, and it skips several things that shape how people actually live:
- Income inequality: a country can post strong average GDP per capita while most households see none of the gain
- Unpaid work: childcare, eldercare, and household labor don’t show up, even though they clearly produce value
- Leisure time: a country that works fewer hours can have lower GDP and a better daily life
- Environmental quality: GDP counts the factory’s output but not the air quality cost next door
GDP per capita can also get inflated by capital income concentrated among a few owners or by heavy public spending that never reaches household budgets. The Core-Econ macroeconomics text makes this point directly: a higher number doesn’t automatically mean better well-being for the people living there.
What Cost-of-Living Indexes Actually Track
A Consumer Price Index (CPI), or its European counterpart the Harmonized Index of Consumer Prices (HICP), tracks how prices change over time inside one country. Statistical agencies build a fixed “basket” of goods and services, from bread to rent to bus fares, and track how much that basket costs month over month.
That’s useful for spotting inflation. It’s the wrong tool for comparing two countries side by side. A CPI trend in Portugal and a CPI trend in Japan are measuring price change against two entirely different baskets, priced in two different currencies, with different consumption habits baked in.
For actual cross-country comparisons, you need a price level index (PLI), which measures how expensive a fixed basket is in one country relative to another, expressed in a common currency. A few things to keep in mind:
- CPI shows price change over time; a PLI shows price differences between places at one point in time
- Baskets vary by country, so “the same basket” is a statistical construct, not a literal shopping list
- Services (a haircut, a restaurant meal) tend to show the widest price swings between countries, more than manufactured goods
Why GDP Per Capita and Real Living Standards Diverge
Three mechanisms explain most of the gap between a headline GDP number and how people actually feel about their money.
Public spending is the biggest one. Healthcare, defense, and infrastructure spending count fully toward GDP, but a chunk of that money never becomes a couch, a vacation, or extra groceries in someone’s kitchen. A country that spends heavily on hospitals and roads can post higher GDP per capita than a peer country without households having more disposable income to show for it.
Sector mix matters too. An economy weighted toward finance, oil extraction, or capital-intensive manufacturing can generate large output per person while wages for most workers stay flat, because the returns concentrate among asset owners rather than flowing broadly through paychecks.
Illustrative point: economics commentary comparing the US and Canada has noted that heavier US spending on healthcare and defense shows up fully in GDP, even though it doesn’t translate one-for-one into visible household goods the way Econlib’s write-up on GDP and living standards describes.
Then there’s inequality, which the average simply can’t see. A national GDP-per-capita figure is a mean, not a median. If income concentrates at the top, most residents live below that average number every day.
Quick checks to spot the gap yourself:
- Compare GDP per capita against median household income when it’s available
- Check what share of GDP comes from government or capital income versus wages
- Look at the country’s Gini coefficient or another inequality measure before trusting an average
How to Compare Living Standards Across Countries Correctly
Comparing GDP across borders using plain exchange rates is one of the most common mistakes people make, and it’s the reason PPPs exist. A Purchasing Power Parity adjusts for the fact that a dollar, converted at the market exchange rate, buys a wildly different amount of bread, rent, or a haircut depending on where you spend it. The OECD’s PPP dataset shows just how wide that gap can be: across the OECD in 2023, PPP-adjusted GDP per capita varied widely relative to the OECD average, a spread that nominal, exchange-rate-converted GDP would badly distort.
Price level indices (PLIs) sit right alongside PPPs in this toolkit. A PLI is essentially the ratio of a PPP to the market exchange rate, and it tells you, in plain terms, how many units of a common currency it takes to buy the same basket of goods in each country, according to the Eurostat-OECD methodological manual.
For household welfare specifically, actual individual consumption (AIC) usually beats GDP per capita as a yardstick. AIC adds in the goods and services governments and nonprofits provide directly to households, like public healthcare or education, capturing consumption that GDP counts but doesn’t attribute to households.
A simple workflow for comparing any two countries:
- Pull PPP-adjusted GDP per capita or AIC per capita for both countries
- Check the price level index to see how expensive each country actually is relative to the other
- Look at the split between public and private consumption, plus an inequality measure, before drawing conclusions
Pro Tip: If you’re comparing two countries for a relocation or salary negotiation, don’t stop at PPP-adjusted income. Layer in a local price index and check housing and transportation costs specifically, since those two categories swing the most between cities and countries.
Which Number Should You Actually Use?
The right statistic depends entirely on the question you’re asking. Match the measure to the job:
| Your question | Best measure |
|---|---|
| How big is this country’s economy or market? | GDP (nominal or real) |
| How does material well-being compare across countries? | GDP per capita (PPP) or AIC |
| How fast are prices rising domestically right now? | CPI or HICP |
| How expensive is Country A versus Country B? | Price level index (PLI) |
| Is this country growing over time? | Real GDP growth, not nominal |
Before you repeat a headline GDP figure, run through a short checklist: is it PPP-adjusted or raw exchange-rate GDP? Is it per capita or a national total? Is it nominal or real? If the answer to any of those is unclear, the number is probably being used to make a point rather than to inform one.
- GDP for economy size and market comparisons
- GDP per capita (PPP) or AIC for comparing actual living standards
- CPI/HICP for tracking inflation inside one country
- PLIs for comparing price levels between countries
Fiatmap’s Data for Comparing GDP and Cost of Living
Data in this article is drawn from official statistical sources, which matters when you’re trying to check a GDP or price claim rather than take it on faith. A few starting points if you want to run these comparisons yourself:
- The GDP glossary entry and GDP per capita explainer walk through the basic definitions covered above
- The PPP glossary page explains purchasing power parity in plain terms before you dig into country data
- The GDP per capita rankings let you line up countries side by side on both nominal and PPP-adjusted terms
- The inflation rankings show how CPI-style price trends differ from one country to the next
For a housing-specific reality check on cost of living, local pricing data like Warsaw’s median price per square meter from notarial deeds shows how granular this gets once you move past national averages.
Don’t Trust a GDP Headline Until You’ve Checked These Three Things
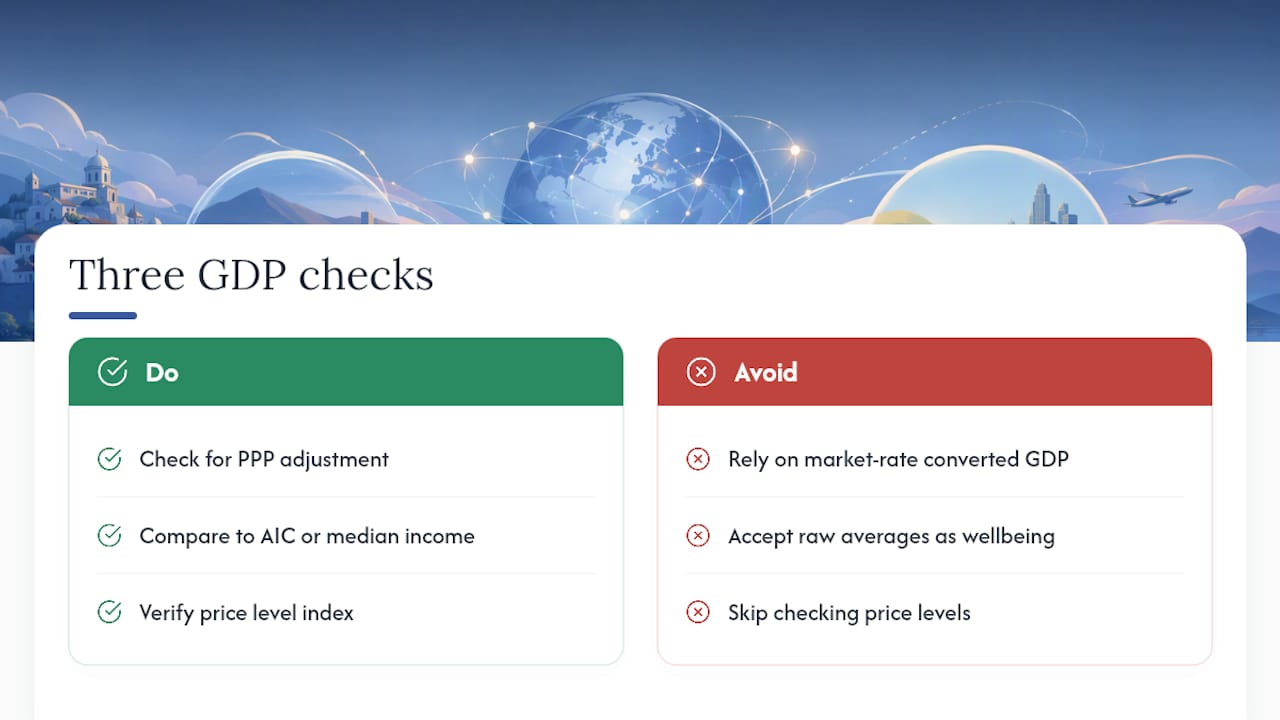
GDP headlines get repeated because they’re simple, not because they’re accurate. A number that ignores distribution, price levels, and what’s actually landing in people’s pockets tells you almost nothing about whether life is better in one country than another.
Before you accept a GDP comparison, run three checks: is it PPP-adjusted rather than converted at market exchange rates, does it look anything like AIC or median income rather than a raw average, and does a price level index confirm the gap is real rather than an artifact of currency conversion. Skip any one of these and you’re arguing with a number that was never built to answer your question.
— Torstein
Where to Verify These Numbers Yourself
The OECD PPP dataset provides the raw purchasing power parity figures. The Eurostat-OECD manual covers the methodology behind them. The World Bank’s ICP publishes AIC. The IMF DataMapper tracks GDP per capita series over time.
Sources
- Purchasing Power Parities | OECD
- International Comparison Program: ICP concepts (World Bank)
- Interpreting GDP — Core-Econ (The Economy)
FAQ
Can You Explain GDP in Simple Terms?
GDP is the total value of everything a country produces in a year, goods and services combined, divided by population to get GDP per capita. It measures production, not household purchasing power, which is why it needs a PPP adjustment before you compare it across countries.
Does Higher GDP Mean a Better Quality of Life?
Not automatically. GDP per capita can rise from public spending, capital income, or a handful of high-output sectors without ordinary households seeing any of that gain, and it says nothing about inequality, leisure time, or unpaid work.
Is It Good or Bad When GDP Goes Up?
Rising real GDP generally signals a growing economy, more jobs, and more overall output, which is usually a positive sign. But it doesn’t guarantee that growth reaches most households, so pair GDP growth with income distribution data before calling it “good news” for everyone.
Does Higher GDP Per Capita Mean a Country Is Richer?
It means the country produces more output per person, which often correlates with higher average income but not always with broader household wealth. PPP-adjusted GDP per capita or AIC gives a far more accurate read on whether residents can actually afford more than residents elsewhere.
What’s the Difference Between CPI and a Price Level Index?
CPI tracks how prices change over time within one country, using a fixed local basket. A price level index compares how expensive that basket is between two countries at the same point in time, which is the measure you need for cross-border comparisons.
Recommended
The figures on this site are collected from official statistics and each carries its own source and date — see /sources and the dataset. Where this article states a number, the country and ranking pages are what it should agree with.