Gini Data for 128 Countries: Reproducible Reference for Researchers
2026-09-11
This page tracks Gini coefficients across countries using the most recent observations from the World Bank’s Gini index and the World Inequality Database, ranked from most equal to most unequal. Before comparing any two countries, check whether their Gini figures measure income or consumption. The platform’s data tools let you pull the underlying series and build your own comparisons once you know which welfare concept you’re working with.
TL;DR:
- The Gini coefficient varies significantly depending on whether it measures income or consumption, affecting comparability across countries.
- Top-income underrepresentation in surveys makes the World Inequality Database and tax-augmented data more accurate for measuring true inequality.
- Latin America and Sub-Saharan Africa consistently show the highest Ginis, while Nordic and Central European countries remain the most equal.
- Differences across datasets are common, with WID estimates often higher due to better top-income data, requiring careful source and welfare concept matching.
- Using multiple inequality measures, like the Palma ratio or T10/B50, provides better insight into distribution nuances than relying on Gini alone.
Table of Contents
- Inequality Gini by Country: Full Ranking and Data
- How Do You Read a Gini Coefficient Correctly?
- Why Gini Numbers Differ Across Databases
- What Regional Patterns Show Up in Recent Inequality Data
- How Fiatmap Helps You Work With Gini Data
- What Actually Matters When You Use This Data
- Get the Underlying Data From Fiatmap
- Where to Go Next for Gini and Inequality Data
- Sources
- FAQ
Inequality Gini by Country: Full Ranking and Data
Gini values below come from the two most cited cross-country sources: the World Bank’s Poverty and Inequality Platform and harmonized survey data compiled through WIID at UNU-WIDER. Every row lists the welfare concept and observation year, because those two details change what a number actually means.
South Africa consistently posts one of the highest national Gini coefficients on an income basis, driven by a legacy of extreme wage and land disparities. Several other Southern African nations, along with a handful of Latin American countries, round out the high end of the distribution. On the low end, Nordic and Central European countries with strong wage compression and large transfer systems typically land below 0.28.
The 10 lowest-Gini countries in the World Bank database cluster almost entirely in Central and Eastern Europe, a pattern tied to compressed wage structures inherited from earlier economic systems and reinforced by current tax and transfer policy. The 10 highest cluster in Southern Africa and parts of Latin America, where land concentration, informal labor markets, and weak redistribution combine to keep the top decile’s income share far above the global norm.
A few things jump out once you sort the full list rather than just the extremes:
- No high-income European country appears in the bottom quartile of global equality; even the least equal, like the United States, sits closer to the middle of the world distribution than to the high end.
- Several oil-exporting and resource-dependent economies show Gini values that swing significantly between survey years, reflecting commodity price cycles rather than structural change.
- Countries that switch from consumption-based to income-based surveys between census rounds often show an artificial jump in measured inequality that has nothing to do with real economic shifts.
For replication work, download the full country panel, including welfare concept flags and source citations, from the Fiatmap Global Money Dataset, available as CSV or JSON under a CC BY 4.0 license.
How Do You Read a Gini Coefficient Correctly?
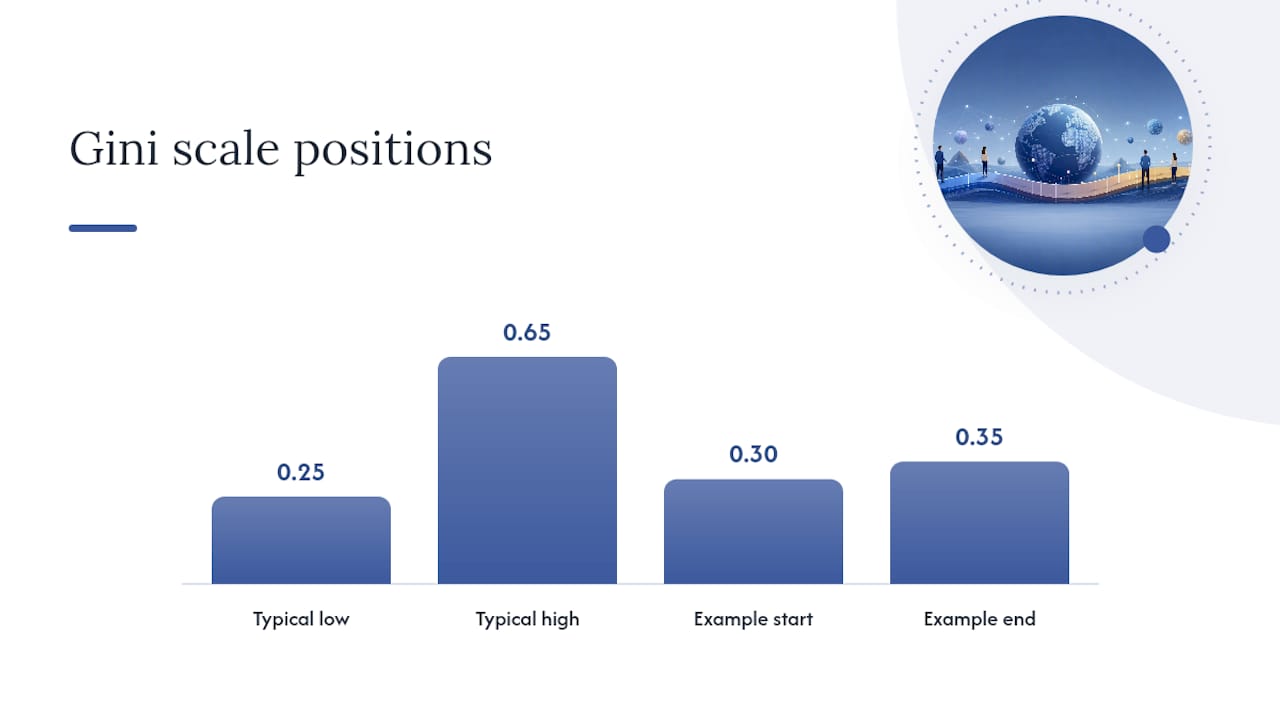
The Gini coefficient runs from 0 to 1 (or 0 to 100 on some scales), where 0 means every household earns identically and 1 means a single household holds all income. In practice, national Ginis rarely fall outside 0.25 to 0.65, so the working range is narrower than the theoretical scale suggests. A move from 0.30 to 0.35 is a much bigger shift in real distribution than the five-point gap implies, because inequality tends to concentrate change in the tails rather than spreading it evenly.
Whether a Gini reflects income or consumption changes the number substantially. Consumption-based Ginis smooth out year-to-year income volatility and tend to run lower, since households borrow and save to stabilize spending even when income fluctuates. Disposable income (after taxes and transfers) produces lower Ginis than market income, because redistribution is the entire point of taxes and transfers. Comparing a country’s consumption Gini to another country’s market-income Gini tells you almost nothing useful.
Analysts serious about cross-country work usually pair the Gini with at least one other measure:
- T10/B50 ratio: the income share of the top 10% divided by the bottom 50%, which captures tail concentration the Gini can understate.
- Palma ratio: top 10% income share divided by the bottom 40% share, designed to be more sensitive to the extremes that drive most policy debates.
- Median-to-mean ratio: a quick check on skew, since a mean far above the median signals a long right tail even before you calculate a full inequality index.
Pro Tip: Never compare two countries’ Gini figures without first confirming both use the same welfare concept and both are within two or three years of each other. A five-year-old consumption Gini next to a current-year income Gini will mislead you every time, no matter how precise both numbers look.
Why Gini Numbers Differ Across Databases
Four sources dominate cross-country inequality data, and they rarely agree exactly. The World Bank’s PIP draws on household surveys collected by national statistical offices, standardized for comparability but limited by how well surveys capture top incomes. WID.world blends those surveys with tax records and national accounts specifically to correct for that top-income undercount, which is why WID estimates often run higher than survey-only figures for the same country and year. WIID at UNU-WIDER aggregates observations from dozens of national and international sources into one harmonized explorer, useful when you need a long historical run rather than the latest snapshot. National statistical offices and the OECD round out the list, offering the most granular country-specific detail but the least cross-country comparability.
Survey-based measures systematically miss income concentrated at the very top, since high earners are underrepresented in survey samples and prone to underreporting. Tax-record augmentation, the method WID uses, closes much of that gap by pulling directly from fiscal data where available.
A unified academic review of global Gini datasets found that income-based Ginis exceed consumption-based Ginis by about 4.7 points on average across countries, though that gap is not uniform. The same review found the income-versus-consumption gap runs small in Europe and Central Asia but considerably wider in North America and parts of Latin America, meaning a flat correction factor will overcorrect in some regions and undercorrect in others.
Before building any cross-country panel, run this checklist:
- Confirm every country-year observation uses the same welfare concept, or apply the region-specific correction factors from the arXiv review rather than a single global adjustment.
- Note whether each figure is gross or net of taxes and transfers.
- Flag observations more than five years old separately from recent ones.
- Record the exact source (World Bank, WID, WIID, or a national office) for every cell, not just for the dataset as a whole.
What Regional Patterns Show Up in Recent Inequality Data
Latin America and Sub-Saharan Africa consistently post the highest national Ginis worldwide, a pattern rooted in land concentration, dual labor markets split between formal and informal sectors, and historically weak fiscal redistribution. Europe, particularly the Nordic and Central European countries, sits at the opposite end, where progressive taxation and strong collective bargaining compress the income distribution well below the global median.
The scale of concentration at the very top is larger than most country-level Gini figures alone suggest. The World Inequality Report 2026 reports that the top 10% of global income earners capture more than half of total income, while the bottom half capture a much smaller share, and the wealthiest 0.1% alone earn more than that entire bottom half combined. Coverage from the LSE Inequalities blog highlights that roughly 56,000 people hold substantially more wealth than half of humanity.
Three takeaways matter most for policy and research work:
- Country-level Gini figures understate global inequality, since most cross-country comparisons ignore what’s happening at the very top of the world distribution, not just within each nation.
- Redistribution through taxes and transfers can move a country’s net Gini substantially below its market-income Gini, so policy conclusions drawn from pre-tax figures alone tend to overstate a government’s inequality problem.
- Any regional average hides enormous within-region variation. Latin America’s average Gini obscures the gap between, say, Uruguay and Brazil almost as much as a global average obscures the gap between regions.
How Fiatmap Helps You Work With Gini Data
The datasets used are sourced directly from official statistics, which matters when you’re trying to replicate a Gini comparison rather than just read one. Tools relevant to inequality research include the downloadable Global Money Dataset, country comparison maps that let you place two or more nations side by side, ranking pages sorted by metric, and embeddable tables for reports or presentations.
A typical workflow looks like this: download the relevant country series, confirm each observation’s welfare concept and harmonize where needed using the correction factors above, then build a time series chart or embed an interactive map directly into your analysis. Because Fiatmap covers GDP per capita and median income alongside inequality-adjacent metrics, you can cross-reference a Gini figure against underlying economic scale without switching platforms.
- Download country-year panels in CSV or JSON for direct import into statistical software.
- Compare two countries side by side using interactive maps rather than static charts.
- Embed a live ranking table in reports so figures update automatically as new data lands.
What Actually Matters When You Use This Data
The single biggest mistake in inequality research isn’t a bad number. It’s a number stripped of its context. A Gini coefficient without a stated welfare concept, observation year, and source is close to meaningless once you start comparing it against anything else. I’d rather see an analyst report a slightly outdated but fully documented figure than a fresh one with no methodological notes attached.
Triangulation beats reliance on any single index. A country’s Gini can sit flat for a decade while its top 10% income share climbs sharply, a pattern the Palma ratio or T10/B50 ratio will catch and the Gini alone will not. Pair the numbers, and share your code and raw series openly. Peer verification is the only real check on a data pipeline, and in a field this prone to silent methodological drift, that check is worth the extra effort.
— Torstein
Get the Underlying Data From Fiatmap
If you’ve been assembling Gini figures from scattered PDFs and mismatched country reports, there’s a faster route. Fiatmap pulls its data directly from official statistics across 128 countries, which means the Global Money Dataset comes pre-sourced and citation-ready rather than requiring you to hunt down each figure’s original publication.

Beyond the raw dataset, Fiatmap’s GDP per capita rankings and monthly earnings comparisons let you contextualize any inequality figure against the underlying economic scale in minutes, without switching between three different agency portals to piece the picture together. The data stories section also walks through how specific inequality and macroeconomic patterns play out in practice, useful if you need narrative context to accompany a chart. Head to the data landing page to download the current release and start building your own comparison today.
Where to Go Next for Gini and Inequality Data
- World Bank PIP: the standard source for survey-based cross-country Gini series and the most widely cited baseline.
- WID.world / World Inequality Report: best for top-income adjusted estimates and global wealth concentration figures.
- WIID Explorer (UNU-WIDER): the deepest archive of harmonized historical observations and country factsheets.
- OECD and national statistical offices: the most detailed country-specific series, though least comparable across borders.
Sources
Different sources use different welfare concepts and income coverage. The WID methodology incorporates tax records to capture top incomes that household surveys tend to miss, which is why WID estimates often run higher than World Bank survey-based figures for the same country and year.
FAQ
Which Country Has the Highest Gini Coefficient?
South Africa consistently records the highest national Gini coefficient in the World Bank’s database, with an income-based value near 0.63, driven by deep historical disparities in land and wage distribution.
Who Owns Roughly Half of the World’s Wealth?
Concentration at the very top is extreme: the World Inequality Report 2026 finds the wealthiest 0.1% of the global population earns more than the entire bottom half of humanity combined, and separate reporting from the LSE Inequalities blog put the figure at roughly 56,000 people holding three times the wealth of half of humanity.
Where Does the United States Rank on Income Inequality?
The United States posts a Gini coefficient around 0.41 on an income basis according to U.S. Census Bureau data, placing it among the more unequal high-income economies, closer to parts of Latin America than to Western Europe.
Can I Download the Full Country Gini Dataset for My Own Analysis?
Yes. Fiatmap’s Global Money Dataset provides country-level series, including inequality-adjacent metrics, in CSV or JSON format under a CC BY 4.0 license for direct use in research or reporting.
Recommended
The figures on this site are collected from official statistics and each carries its own source and date — see /sources and the dataset. Where this article states a number, the country and ranking pages are what it should agree with.