2.1% vs 3.4%: Why U.S. Inflation Adjusted Home Prices Are Flat
2026-09-13
Inflation-adjusted house prices measure what home values look like after stripping out general inflation, calculated by dividing a nominal price index like Case-Shiller by the Consumer Price Index and rebasing the result. Through mid-2026, nominal U.S. home prices are still climbing, but real gains are thin: the FHFA reported prices up 2.1% year over year in Q2 2026, while overall inflation ran close behind it. That gap, not the headline number, tells you whether housing is actually getting more expensive in real terms.
TL;DR:
- Real house prices have shown minimal growth since 2023, with inflation nearly matching nominal appreciation, indicating a stagnating or flat real market.
- The 2006 bubble saw historic peaks with genuine real gains, followed by a sharp decline, and recent recovery stalled by rising mortgage rates and inflation.
- Comparing indices from 2006 to 2026 is misleading; percent-change over set periods reveals the true slower or negative real appreciation trends.
- CPI-based real price measures overlook mortgage rates and income changes, which can paint a different picture of housing affordability and fundamentals.
- Most pandemic-era house price spikes are offset by inflation and higher financing costs, reducing the likelihood of an ongoing bubble in the current market.
Table of Contents
- What Are Inflation-Adjusted House Prices?
- How Real Home Prices Have Moved Over Two Decades
- What Rising or Falling Real Prices Actually Mean
- Where to Pull the Raw Data Yourself
- Are U.S. Home Prices Stretched or Just Sluggish?
- Build Your Own Real Price Charts With Fiatmap
- Where the Numbers Come From
- Sources
- FAQ
What Are Inflation-Adjusted House Prices?
A nominal home price tells you what a house costs in today’s dollars. An inflation-adjusted price tells you what that same house costs relative to everything else you buy. Divide the nominal index by the CPI level for the same period, then rebase the result to 100 at a chosen starting date, and you get a real home price series you can track over decades.
Here’s the step-by-step version anyone can reproduce with a spreadsheet:
- Pick a nominal index. The S&P CoreLogic Case-Shiller national index or the FHFA House Price Index both work, though they measure slightly different things.
- Pull the matching CPI series from the Bureau of Labor Statistics, typically CPI-U, for the same months or quarters.
- Divide the nominal index value by the CPI value for each period.
- Rebase the resulting ratio to 100 at a reference date, usually the earliest year in your dataset.
- Plot the rebased series and read the trend, not the absolute level.
Case-Shiller and the FHFA HPI diverge in ways that matter. Case-Shiller uses repeat-sales pairs on the same properties and covers a narrower slice of the market historically, while the FHFA HPI pulls from mortgages backed by Fannie Mae and Freddie Mac going back to 1975, giving it broader geographic reach and a longer track record. Case-Shiller also publishes a purchase-only version and an all-transactions version, and the two can tell slightly different stories in the same quarter.
The trickiest methodological choice is picking your CPI variant. Standard CPI-U includes a shelter component, which means you’re partly dividing a housing measure by an index that already contains housing costs. Some analysts strip out shelter from the CPI denominator to avoid this overlap; most popular real-price series don’t bother, and the distortion is usually small unless shelter inflation is moving sharply against the broader trend.
Watch for three common errors: mismatching monthly and quarterly frequencies, using seasonally adjusted data in the numerator but not the denominator, and forgetting to document your rebasing date, which makes it impossible to compare your chart against someone else’s. If you want the underlying mechanics without building it yourself, the house price index glossary entry and the CPI glossary entry walk through both series in plain terms.
How Real Home Prices Have Moved Over Two Decades
Real house prices don’t move in a straight line, and the last twenty years contain two genuinely extreme episodes worth knowing by name.
- Mid-2000s bubble: Real home prices hit a historic peak around 2006, with nominal appreciation far outrunning inflation for years running.
- 2007 to 2012 decline: The correction that followed wiped out most of that real gain, dragging adjusted prices back toward, and in some markets below, their late-1990s levels.
- 2012 to 2019 recovery: A slow, grinding climb back up, aided by low mortgage rates and tight post-crisis lending standards that kept speculative excess in check.
- 2020 to 2022 surge: Real prices spiked again as cheap money, pandemic-era demand shifts, and constrained inventory pushed nominal appreciation well past inflation, reaching another peak in 2022.
- 2023 to 2026 moderation: Higher mortgage rates cooled the pace of nominal gains, and rising CPI ate into much of what remained, flattening the real-price trend.
Rebased index levels only mean something relative to their reference date, so comparing a level from 2006 to a level from 2026 tells you little on its own. Percent-change windows, one-year, five-year, twenty-year, are the more honest way to read the story, because they isolate the rate of change rather than an arbitrary starting point.
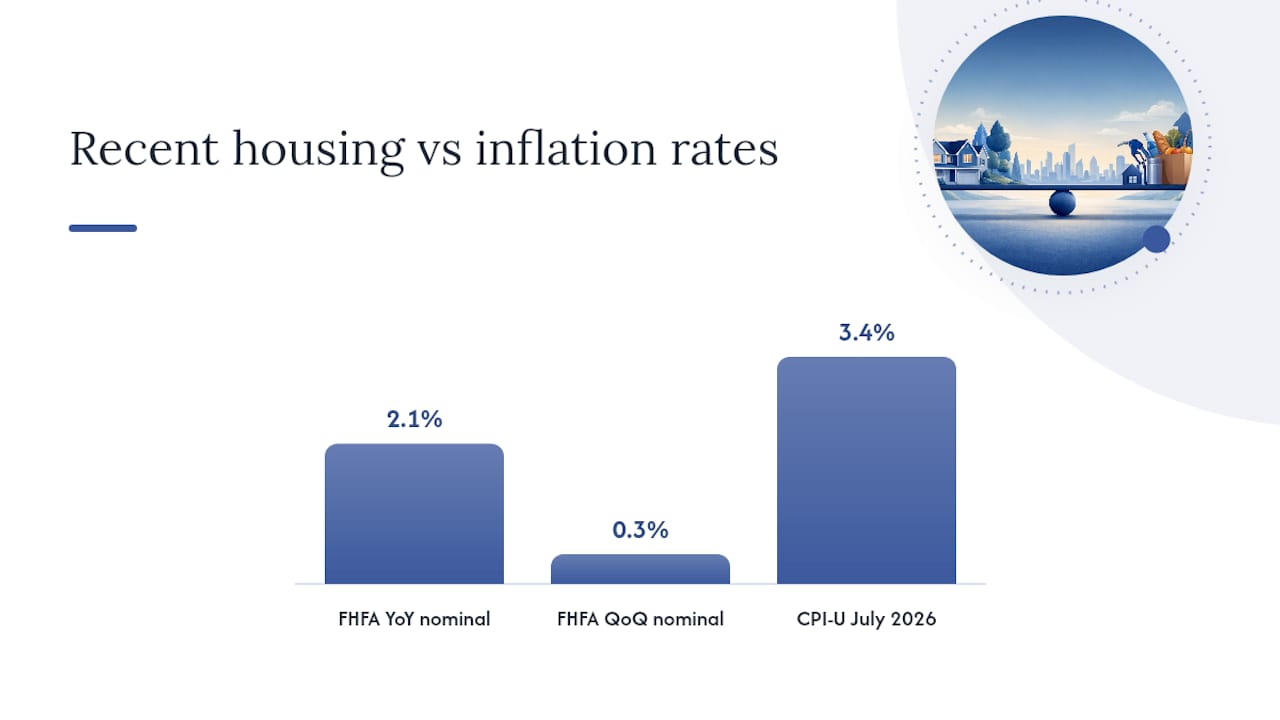
The current reading: the FHFA’s Q2 2026 data shows nominal prices up 2.1% year over year and just 0.3% quarter over quarter, a pace that barely outruns inflation once you account for the 3.4% CPI-U increase reported for July 2026. That combination, sluggish nominal growth against inflation running nearly as fast, is the signature of a real price series that’s essentially flat, not the signature of another bubble or a fresh boom.
What Rising or Falling Real Prices Actually Mean
A nominal price increase feels good on a mortgage statement, but it doesn’t tell you whether your house is building real wealth or just keeping pace with a shrinking dollar. Real gains, appreciation beyond the inflation rate, are what actually expand purchasing power. A home that rose 3% while inflation ran 3.4%, which is roughly where the national CPI-U stood in July 2026, technically lost value in real terms even though the sale price went up.
CPI-deflated prices are a blunt instrument, though. They ignore two variables that determine whether a house is actually affordable: mortgage rates and household income. First American’s Real House Price Index, or RHPI, adjusts for both, and it often tells a different story than a simple CPI-deflated series. A region can show flat or even rising real CPI-adjusted prices while its RHPI falls, if incomes are climbing or mortgage rates are easing, because the monthly payment burden on a typical buyer is shrinking even as the sale price holds steady.
That distinction separates fundamentals from speculation. A few signals worth tracking side by side:
- Real price growth outpacing rent growth for several consecutive quarters, a pattern that preceded the 2006 peak.
- Nominal appreciation accelerating while mortgage rates are also rising, which usually signals credit-driven demand rather than income-driven demand.
- Real prices flat or falling while incomes rise, which tends to improve affordability even if headlines call it a “weak” housing market.
Pro Tip: Don’t just track the price index. Pull the mortgage rate alongside it. A flat real price with falling rates can mean monthly payments are dropping even though the sale price on paper isn’t.
For buyers, a stretched real-price market with rising rates is the worst combination: you’re paying more in real terms and financing it more expensively. For investors, the same setup raises the odds that current pricing reflects credit conditions rather than durable demand.
Where to Pull the Raw Data Yourself
Every series referenced in this article is public and free to download, and rebuilding the chart takes an afternoon, not a data science degree.
Start with these exact sources:
- Case-Shiller national index: available through FRED under series ID CSUSHPINSA, or directly from Robert Shiller’s own published spreadsheet.
- FHFA House Price Index: downloadable by state, metro, or national level from the FHFA’s data and methodology page, which also documents the repeat-sales weighting.
- CPI-U: pulled from FRED under series ID CPIAUCSL, or straight from the BLS CPI portal.
- FHFA HPI calculator: a built-in tool at the FHFA’s HPI calculator page that converts nominal values into indexed percent changes for any state or metro without touching a spreadsheet.
To rebuild the ratio in Excel or Python: import both series, align them by date, divide the home price index by the CPI value, rebase to 100 at your chosen start date, and chart the result against time. If you’d rather skip the import step, Fiatmap’s own global money dataset offers official-statistics-based figures in CSV and JSON, and the house price growth rankings let you compare the U.S. trend against other countries without building anything from scratch.
Are U.S. Home Prices Stretched or Just Sluggish?
The 2026 numbers don’t look like a bubble. That doesn’t mean prices are cheap. It means the market has stopped outrunning inflation, which is a very different problem for a buyer than a market that’s actively overheating.
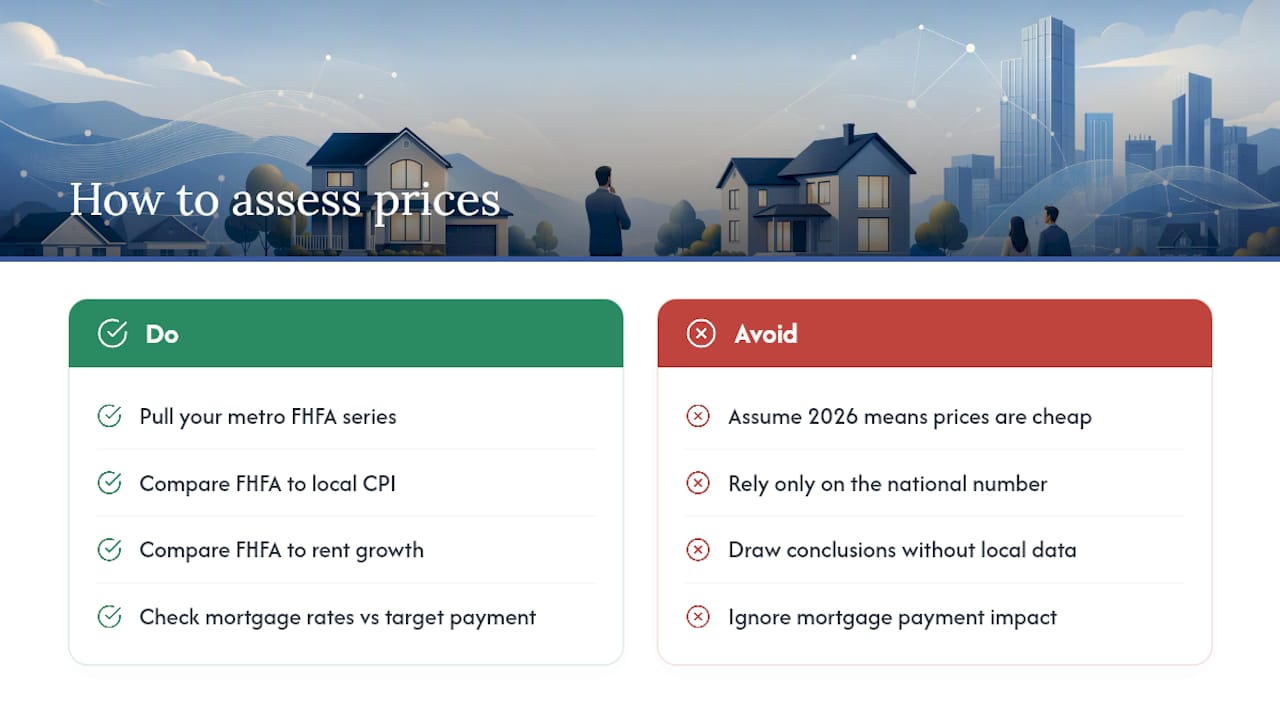
If you want to go deeper than the national number, pull your own metro’s FHFA series and run it against local CPI or rent growth before drawing conclusions. Check current mortgage rates against your target payment, and if a chart would help you see the trend rather than just read it, the tools and downloadable data below are built for exactly that.
— Torstein
Build Your Own Real Price Charts With Fiatmap
Most people trying to answer “is housing actually more expensive right now” get stuck stitching together FRED series, BLS releases, and FHFA PDFs by hand. The assembly work of pulling mortgage rates, inflation rates, and dozens of other macroeconomic indicators from official government statistics across multiple countries can be done for you, so the same rebasing method covered here can be applied to any market you’re comparing against the U.S.

The global money dataset is downloadable in CSV and JSON, which means you can run the exact Case-Shiller divided by CPI calculation from this article without hunting down and cleaning three separate government sources. Pair it with the mortgage rates by country ranking to see how financing costs are shifting alongside home values, or check the house price growth rankings to put the U.S. trend next to other economies. If you’re weighing whether current pricing reflects real appreciation or just borrowing conditions, start by pulling the dataset and running your own local numbers against it.
Where the Numbers Come From
- BLS CPI portal: the source for Consumer Price Index data and methodology, used to deflate nominal price series.
- FHFA HPI data and calculator: official repeat-sales index and calculator covering states and metros back to 1975.
- Shiller historical data: the original Case-Shiller spreadsheet behind the national index.
- Fiatmap data hub: downloadable CSV/JSON datasets sourced from official statistics across 128 countries.
Sources
- FHFA house price index Q2 2026 (FHFA)
- FHFA house price index data and methodology (FHFA)
- Robert Shiller data (Case-Shiller / historical series)
FAQ
What Salary Can Afford a $500,000 House?
Check the current mortgage rate for your loan type before running the math, since a one-point rate swing changes the required income by thousands of dollars.
Will the Housing Bubble Burst in 2026?
Nothing in the current data resembles the run-up to 2006: FHFA reported nominal price growth of just over 2% year over year in Q2 2026, barely ahead of inflation, rather than the double-digit real gains that preceded the last bubble. A moderation, not a crash, is the more accurate read of the current trend.
What Is the Hardest Month to Sell a House?
Winter months, particularly December and January, typically see the slowest sales activity nationally, driven by holiday schedules and colder weather discouraging showings. This is a seasonal pattern in transaction volume, not a reflection of inflation-adjusted pricing trends.
How Much Has Housing Increased in the Last 10 Years?
Nominal U.S. home prices have risen substantially over the past decade, spanning the 2020 to 2022 surge and the subsequent cooling into 2026. The real, inflation-adjusted gain is smaller than the nominal figure suggests, since a meaningful share of that decade’s price growth was offset by cumulative CPI increases, including the 3.4% inflation rate recorded in July 2026.
Recommended
The figures on this site are collected from official statistics and each carries its own source and date — see /sources and the dataset. Where this article states a number, the country and ranking pages are what it should agree with.