2.30% Example: Inflation Breakevens Explained for Investors
2026-09-16
The breakeven inflation rate is the yield gap between a nominal Treasury security and a same-maturity Treasury Inflation-Protected Security, or TIPS. That gap represents the market’s implied average inflation rate over the bond’s horizon, plus a couple of add-ons investors often forget. Treat it as a market price, not a clean forecast, since it also bundles in an inflation-risk premium and a liquidity premium.
TL;DR:
- The breakeven inflation rate is influenced by inflation expectations, inflation-risk premiums, and liquidity premiums, not only market forecasts.
- Mismatch in bond maturities and differences in coupon structures can distort simple yield subtractions, requiring adjustments or use of Treasury’s spot-rate curve for accuracy.
- Short-term breakevens reflect immediate inflation pressures, while the 10-year and 30-year signals indicate medium- and long-term expectations, respectively.
- Rising breakevens can indicate higher expected inflation or falling real yields, but separating these effects requires analyzing individual yield movements.
- Always triangulate breakevent data with surveys, models, and realized inflation to avoid misinterpreting technical market fluctuations as genuine expectations.
Table of Contents
- Understanding Inflation Breakevens: Why Compare Nominal Bonds With TIPS
- How to Calculate Breakevens Using Live Treasury Yields
- What Do 5-Year, 10-Year, and 30-Year Breakevens Signal?
- Reading Breakeven Moves: What They Tell Investors and Policymakers
- Why Breakevens Aren’t a Pure Inflation Forecast
- Yield Spread Versus TBI: Two Ways to Measure the Same Thing
- Where to Find Live Breakeven Data and Official Models
- A Worked Example: Calculating a 5-Year Breakeven From Scratch
- How Investors Actually Use Breakevens in Portfolio Decisions
- Verifying Breakeven Data With Fiatmap’s Tools
- Using Breakevens Responsibly: A Closing Perspective
- A Faster Way to Cross-Check Inflation Data
- Sources
- FAQ
Understanding Inflation Breakevens: Why Compare Nominal Bonds With TIPS
The formula is simple to state and easy to misuse: breakeven inflation rate = nominal Treasury yield minus TIPS real yield, for the same maturity. If a 10-year Treasury note yields a nominal rate and the 10-year TIPS yields a real rate, the breakeven comes out to the difference between those yields, typically expressed in basis points. Basis points matter here because breakevens move in small increments, often just a few basis points a day, and quoting them in percent alone can hide meaningful shifts — see this concise breakeven inflation glossary entry for a clear explanation.
The intuition behind the math comes down to how each bond pays you back. A nominal Treasury promises fixed dollar coupons and a fixed dollar payment at maturity, no matter what happens to prices in the economy. A TIPS bond adjusts its principal value in line with the Consumer Price Index, so its payout keeps pace with realized inflation. An investor holding a TIPS bond to maturity gets compensated automatically for inflation; an investor holding the nominal bond does not.
That structural difference is exactly why the spread between the two works as a market signal. If bond buyers expect higher future inflation, they will demand a higher nominal yield to make up for the eroding purchasing power of those fixed dollar payments, while the TIPS yield stays anchored to a real, inflation-adjusted return. The wider that gap gets, the more inflation the market is pricing in. This is why breakeven inflation rates function as one of the cleanest, most frequently updated windows into market based inflation expectations, updated every trading day as bond prices shift.
How to Calculate Breakevens Using Live Treasury Yields
Working out a breakeven rate takes four steps, and the arithmetic itself is grade-school simple. The part that trips people up is matching maturities correctly and knowing when a simple subtraction stops being a reliable read.
- Pull the matched-maturity nominal yield. Find the yield on a conventional Treasury note or bond with the exact maturity you want, say the 10-year.
- Pull the same-maturity TIPS real yield. Look up the TIPS yield for that identical maturity date, not just the closest available tenor.
- Subtract. Nominal yield minus TIPS yield gives you the breakeven, typically expressed in basis points before you convert.
- Convert to percent. Divide the basis-point figure by 100 to state it as a percentage, the form most commonly quoted in financial media.
Maturity matching is where a lot of casual calculations go wrong. TIPS issuance doesn’t line up perfectly with nominal Treasury auction calendars, so the “10-year TIPS” you find quoted might actually mature eight months earlier or later than the nominal note you’re comparing it against. That mismatch introduces noise, especially at the short end of the curve where a few months makes a real difference in implied inflation.
Coupon structure adds a second wrinkle. Two bonds with the same maturity date but different coupon rates have slightly different effective durations, which means a simple yield subtraction doesn’t perfectly isolate the inflation compensation embedded in price. This is one reason the Treasury built a spot-rate curve instead of relying purely on raw yield spreads, a point worth revisiting once you understand the basic mechanics.
One more practical note: TIPS and nominal Treasuries are taxed differently. TIPS principal adjustments are taxable in the year they occur even though you don’t receive that cash until maturity or sale, sometimes called “phantom income.” That doesn’t change the breakeven calculation itself, but it matters when you’re deciding which bond to actually hold in a taxable account.
What Do 5-Year, 10-Year, and 30-Year Breakevens Signal?
Different maturities answer different questions, and reading them side by side tells you more than any single number.
- 5-year breakeven: reflects near-term inflation pressure, heavily influenced by current commodity prices, wage data, and the freshest CPI prints. It swings the most in response to headline economic news.
- 10-year breakeven: the most widely quoted maturity, treated as a general barometer of medium-term inflation expectations across the full business cycle.
- 30-year breakeven: captures long-horizon inflation compensation, useful for pension funds and insurers matching liabilities decades out, but thinner trading can make it noisier than its length suggests.
- 5-year, 5-year forward breakeven: a derived measure showing implied inflation for the five-year period starting five years from now, which strips out near-term noise and functions as a read on long-run central-bank credibility.
The 5y5y forward deserves special attention because it’s the measure Federal Reserve officials watch most closely for anchoring signals. If near-term breakevens spike after an oil shock but the 5y5y forward barely moves, that tells you the market still trusts the inflation target will hold once the shock passes. When the 5y5y forward itself starts drifting, that’s a more serious signal that inflation expectations, tied closely to the inflation target central banks defend, may be coming unanchored.
Reading Breakeven Moves: What They Tell Investors and Policymakers
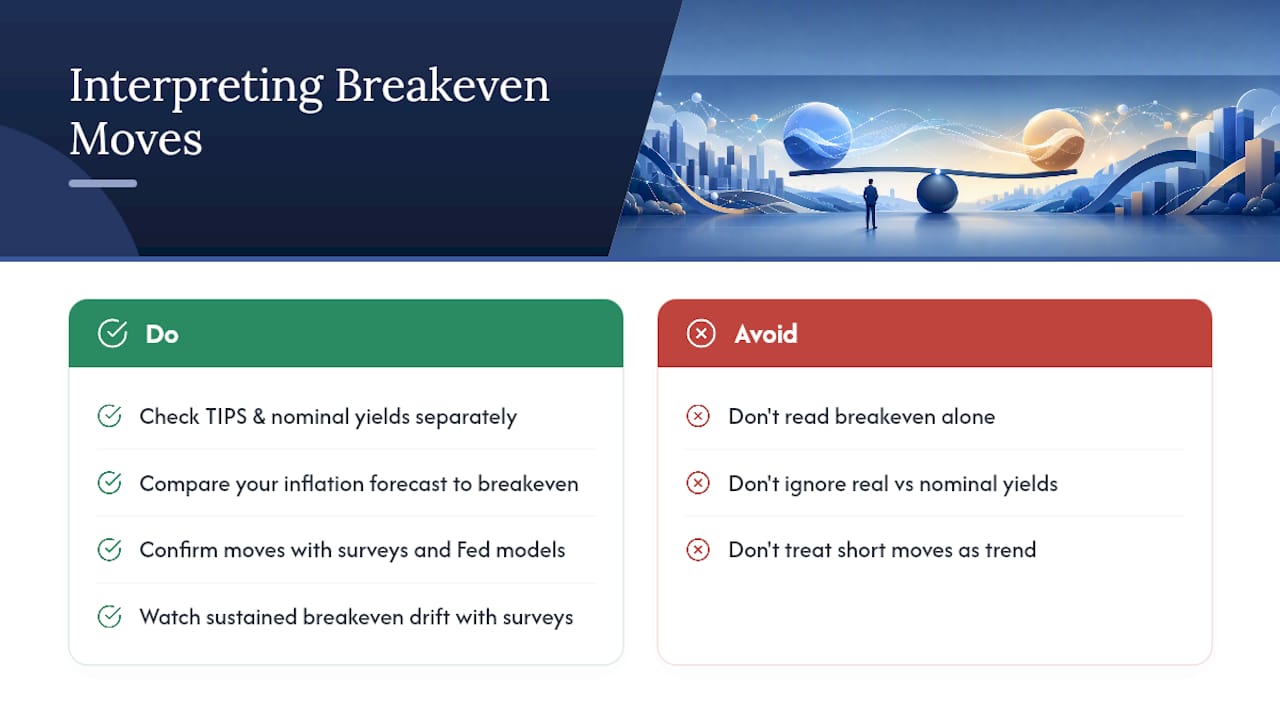
A rising breakeven usually means one of two things: the market expects higher future inflation, or real yields are falling faster than nominal yields, which mechanically widens the spread even without a change in inflation views. Separating those two forces requires looking at the TIPS yield and nominal yield individually, not just the spread.
For investors choosing between nominal Treasuries and TIPS, the breakeven functions as a relative pricing signal. If your own inflation forecast sits above the current breakeven, TIPS look cheap relative to nominal bonds, since you’d expect the inflation adjustment to outpace what the market is currently pricing. If your forecast sits below the breakeven, nominal Treasuries offer better relative value. This comparison is also a useful entry point into thinking about the core inflation trend versus the volatile CPI components that tend to move short-horizon breakevens the most.
Central banks watch breakevens as a real-time credibility check. A sustained drift higher in the 10-year or 5y5y forward breakeven, especially if it happens alongside rising survey-based expectations, can pressure policymakers to act before inflation psychology gets embedded in wage and pricing decisions.
None of this works well in isolation, though. The St. Louis Fed’s research on long-run inflation expectations found that market-based measures like breakevens broadly track survey and model-based expectations over time, but they diverge often enough that no single measure should be read alone. Confirm a breakeven move against consumer surveys and Fed model output before treating it as a real shift in expectations rather than a technical wobble.
Why Breakevens Aren’t a Pure Inflation Forecast
Breakevens carry more information than just expected inflation, and that extra baggage is exactly what trips up casual readers of the data.
- Inflation-risk premium: investors demand extra compensation for the uncertainty around future inflation itself, not just its expected level. Structural estimates commonly place this premium in the range of roughly 20 to 50 basis points, meaning a chunk of every quoted breakeven isn’t “expected inflation” at all.
- TIPS liquidity premium: TIPS trade in a smaller, less liquid market than nominal Treasuries. When investors demand extra yield to hold a less liquid asset, that inflates the TIPS yield and mechanically compresses the breakeven, independent of any inflation view.
- Technical flows: Treasury issuance patterns, dealer inventory levels, and central-bank purchase programs can push yields around for reasons that have nothing to do with inflation expectations.
- Stress-period distortions: during periods of market stress, TIPS liquidity can dry up sharply and even reverse the normal relationship between the two bond types, making the breakeven signal unusually noisy right when people want to trust it most.
Pro Tip: Before reading too much into a sudden breakeven move, check whether TIPS trading volume or bid-ask spreads widened that same day. A jump driven by a TIPS liquidity squeeze looks identical on a chart to a genuine inflation scare, but the two call for completely different portfolio responses.
Yield Spread Versus TBI: Two Ways to Measure the Same Thing
The simple subtraction method described above works fine for a quick check, but it has a known flaw: coupon timing and the shape of the yield curve can distort the result, especially when nominal and TIPS bonds have meaningfully different coupon rates. Two bonds maturing on the same date but structured differently don’t deliver an apples-to-apples read on inflation compensation.
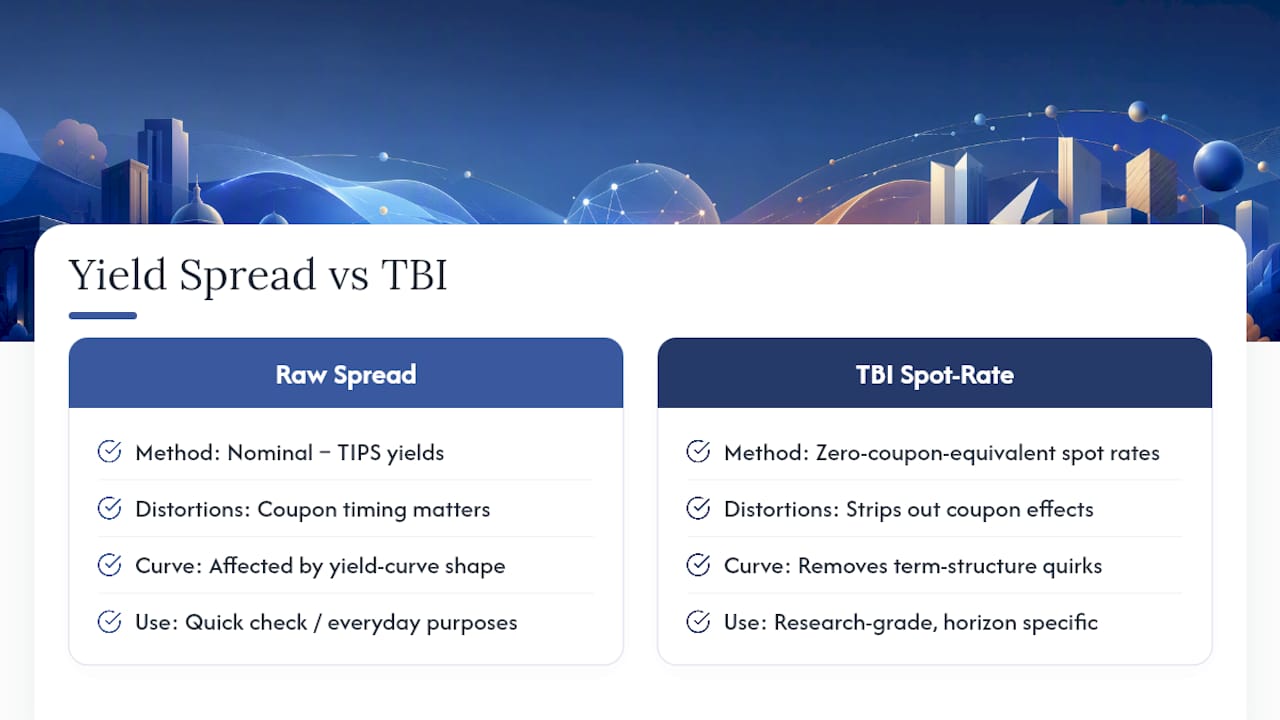
To fix this, the U.S. Treasury constructs a spot-rate Treasury Breakeven Inflation (TBI) curve, which strips out coupon effects and term-structure quirks by working from zero-coupon-equivalent rates rather than raw quoted yields. The result is a horizon-specific breakeven estimate that holds up better for research and policy analysis than a raw yield spread. The Treasury’s own documentation on the TBI curve lays out exactly how this spot-rate construction removes those distortions.
For most everyday purposes, checking a quoted 5-year or 10-year breakeven from a reliable source is good enough. If you’re doing anything closer to research grade work, comparing a specific horizon over time or feeding a breakeven into a model, use the TBI spot-rate series instead of a raw yield spread. Understanding the underlying yield curve shape helps explain why coupon timing matters so much to this distinction in the first place.
Where to Find Live Breakeven Data and Official Models
You don’t need a Bloomberg terminal to track breakevens; the primary sources are public and update daily.
- FRED (Federal Reserve Economic Data) publishes the 10-year breakeven inflation series along with a matching 5-year series, both updated daily and fully documented with construction notes.
- U.S. Department of the Treasury publishes the TBI spot-rate curve directly, the source series behind the horizon-adjusted figures researchers prefer.
- Cleveland Fed runs a model-based inflation expectations tool covering 1-year to 30-year horizons, and it explicitly decomposes expected inflation into the inflation-risk premium, a real risk premium, and the real interest rate.
- Minneapolis Fed publishes market-based probability research that complements breakeven data with model references on how markets price inflation risk across different scenarios.
Before quoting any published series, check its methodology note. A chart labeled simply “breakeven inflation” is usually the raw yield spread, while anything labeled “TBI” or “spot rate” has gone through the Treasury’s coupon-adjustment process.
A Worked Example: Calculating a 5-Year Breakeven From Scratch
Here’s how you’d work through it.
- Convert both to basis points for precision. 4.05% equals 405 basis points; 1.75% equals 175 basis points.
- Subtract. 405 minus 175 equals 230 basis points.
- Convert back to percent. 230 basis points equals a 2.30% breakeven inflation rate.
- Interpret with caution. That 2.30% figure represents the market’s implied average annual inflation over the next five years, but it still contains an inflation-risk premium and whatever liquidity premium is currently priced into the 5-year TIPS.
If you pulled these numbers on a day when TIPS liquidity was unusually thin, say during a broader bond market selloff, the real breakeven-implied inflation view might be a few basis points different from the headline 2.30%. Cross-check the figure against the FRED series and, ideally, against the Treasury’s spot-rate TBI number for the same date; a large gap between the raw spread and the TBI figure tells you coupon distortions are doing real work that day.
How Investors Actually Use Breakevens in Portfolio Decisions
Breakevens rarely drive a decision on their own, but they shape a handful of concrete choices for fixed-income investors.
- TIPS versus nominal allocation: an investor who believes realized inflation will exceed the current breakeven tilts toward TIPS; one who expects inflation to run below it favors nominal Treasuries, all else equal.
- Duration adjustments: a rapidly widening breakeven at the short end while the long end stays flat can prompt a shift toward longer-duration nominal debt, betting the inflation scare is temporary.
- Hedge sizing: portfolio managers use breakeven levels as one input, alongside the real interest rate, when sizing inflation hedges across commodities, TIPS, and floating-rate instruments.
- Central-bank credibility monitoring: a steady 5y5y forward breakeven despite short-term inflation noise is read as a sign that policy credibility remains intact, which itself feeds back into asset-allocation confidence.
The mistake to avoid is treating any single breakeven reading as a standalone trading signal. Confirm the direction with survey-based expectations and model output before resizing a position based on breakevens alone.
Verifying Breakeven Data With Fiatmap’s Tools
Fiatmap maintains a Global Money Dataset covering more than 35 macroeconomic metrics across 128 countries, sourced exclusively from official statistics agencies and central banks. That matters when you want to check a breakeven-driven inflation view against what’s actually happening in consumer prices on the ground.
Readers can use inflation rankings to compare realized inflation rates across countries, download the underlying data in CSV or JSON format, or embed a live widget directly into research notes. An inflation map is a fast way to see whether the inflation story implied by U.S. breakevens looks similar or different abroad. This article was written by Torstein for Fiatmap’s editorial team, covering macroeconomic data and Treasury markets.
Using Breakevens Responsibly: A Closing Perspective
Breakevens get treated as an oracle far too often, and that’s the wrong way to use them. They’re a market price, shaped as much by liquidity conditions and risk premia as by anyone’s honest view of future inflation. The inflation-risk premium alone can run several dozen basis points, which means a chunk of every headline breakeven number isn’t a forecast at all.
The right habit is triangulation. Check the breakeven against Cleveland Fed model estimates, against consumer surveys, and against realized inflation trends in comparable data series before drawing a conclusion. A tool like Fiatmap’s inflation rankings makes that cross-check faster, letting you see whether a U.S. breakeven move lines up with what’s happening in comparable economies or looks like an isolated technical wobble.
— Torstein
A Faster Way to Cross-Check Inflation Data
Chasing down comparable inflation figures across sources, and across countries, takes time most investors don’t have. This is solved by pulling inflation, interest rate, and cost-of-living data for many countries into one place, sourced entirely from official statistics agencies rather than aggregated estimates.

If you’ve just worked through a breakeven calculation and want to see how U.S. inflation stacks up against other economies, the inflation rankings let you compare rates side by side in a few clicks. Analysts who need the raw numbers for their own models can pull the full Global Money Dataset in CSV or JSON format, free of charge and licensed under CC BY 4.0. Start by checking how your breakeven-implied inflation view compares to the actual inflation data Fiatmap tracks for your market of interest.
Sources
- Breakeven inflation | FRED Blog
- The Treasury Breakeven Inflation Curve
- The Dynamics of Long-Run Inflation Expectations: A Market-Based Perspective — St. Louis Fed (2025)
FAQ
What Is the Current 5-Year Breakeven Inflation Rate?
The 5-year breakeven changes daily based on Treasury and TIPS trading, so there’s no fixed figure to quote here. Check the live series on FRED or the Treasury’s own TBI curve for the current reading, and remember it includes an inflation-risk premium on top of pure expectations.
What Does the 10-Year Breakeven Inflation Rate Mean?
The 10-year breakeven is the yield gap between a 10-year nominal Treasury and a 10-year TIPS bond, representing the market’s implied average annual inflation over that decade. It’s the most widely quoted breakeven maturity because it balances near-term noise against long-run signal.
How Do I Calculate a Breakeven Inflation Rate?
Subtract the TIPS real yield from the nominal Treasury yield for the same maturity, then express the result in basis points or percent. For research-grade precision, use the Treasury’s spot-rate TBI curve instead of a raw yield spread, since it removes coupon-timing distortions.
Why Isn’t the Breakeven Rate the Same as Expected Inflation?
Breakevens bundle in an inflation-risk premium and a TIPS liquidity premium alongside pure inflation expectations. Structural estimates often place the inflation-risk premium in the range of 20 to 50 basis points, meaning the headline number overstates expected inflation by that much.
Where Can I Verify Breakeven and Inflation Data Myself?
FRED, the U.S. Treasury, and the Cleveland Fed all publish free, documented breakeven and inflation-expectation series. For cross-country context, Fiatmap’s inflation rankings and downloadable Global Money Dataset let you compare realized inflation against what breakevens are implying.
Recommended
The figures on this site are collected from official statistics and each carries its own source and date — see /sources and the dataset. Where this article states a number, the country and ranking pages are what it should agree with.