2.7% vs 3% Risk: Inflation Outlook 2026 for Analysts
2026-09-05
Global headline inflation is projected to increase modestly in 2026 before falling in 2027, driven by energy prices and lingering trade friction, while U.S. core PCE is expected to settle closer to the Fed’s 2% goal but with real dispersion around that median. The two swing factors are commodity or geopolitical shocks and how long the Fed holds rates. The numbers, confidence ranges, and portfolio implications follow below.
TL;DR:
- Global inflation in 2026 is expected to rise modestly due to energy and geopolitical shocks, primarily impacting emerging markets with less policy buffers.
- U.S. core PCE inflation is projected to approach the 2% Federal Reserve target, with a range of scenarios from steady rates to surprise tightening based on energy and wage pressures.
- Key risks include supply disruptions from the Middle East conflict, tariff escalations, and wage growth outpacing productivity, which could raise inflation above baseline forecasts.
- Conversely, productivity gains from AI adoption and demand slowdown could lower inflation faster than expected, especially in advanced economies with more fiscal room.
- Portfolio strategies should consider different inflation scenarios by analyzing country-specific risks, real yields, and sector sensitivities rather than relying solely on median forecasts.
Table of Contents
- Global Inflation Outlook 2026: What the IMF and Other Forecasters See
- U.S. Inflation Outlook 2026: FOMC Medians, CBO, and the Fed’s Path
- Key Drivers and Risks Shaping the 2026 Inflation Trajectory
- How Reliable Are 2026 Inflation Forecasts? Reading the Confidence Ranges
- What the 2026 Outlook Means for Portfolio Positioning
- How This Forecast Was Built
- Fiscal Policy’s Growing Weight on the 2026 Inflation Picture
- Supply Chains and the Bottlenecks That Could Reshape the Outlook
- What Higher Inflation Actually Means for Household Budgets
- Where 2026 Fits in the Longer Inflation Story
- What Analysts Should Actually Do With This Outlook
- Build Your Own Inflation Scenarios With Fiatmap’s Dataset
- Primary Sources Worth Reading Directly
- Sources
Global Inflation Outlook 2026: What the IMF and Other Forecasters See
The clearest single data point for the global inflation outlook 2026 comes from the IMF’s July update to its World Economic Outlook: headline inflation worldwide rises modestly in 2026 compared to 2025, then eases in 2027. That is not a runaway acceleration. It is a bump, largely attributable to energy markets and a tense geopolitical backdrop, layered on top of a disinflation trend that has been running since the 2022 peak.
The IMF’s April World Economic Outlook had already flagged this pattern, pairing the inflation uptick with a global growth forecast of 3.1% for 2026. Growth holding near trend while inflation creeps higher is the signature of a supply-side disturbance rather than an overheating economy. That distinction matters for how central banks are likely to respond: a supply shock argues for patience, not aggressive tightening, because rate hikes do little to fix a tanker traffic jam or an oil price spike.
Regional divergence is the part of the story that gets lost in headline figures. The IMF’s April report is explicit that emerging market and developing economies will absorb a disproportionate share of the 2026 inflation pressure, largely because they carry heavier exposure to imported energy and food, and because many have already burned through the policy buffers they built after the pandemic. Advanced economies, by contrast, generally have more room to maneuver, whether through central bank credibility or fiscal capacity.
The Middle East conflict sits at the center of this dynamic. Energy markets react fast to supply-route disruptions, and even a modest risk premium on crude oil flows straight into transport and manufacturing costs worldwide. Combine that with a second wave of tariff announcements in several major economies, and you get a plausible explanation for why the IMF’s forecast tilts upward in 2026 rather than continuing the smooth decline many analysts expected two years ago.
Here is how the regional picture breaks down for analysts building country-level models:
- Advanced economies: Inflation pressure is more contained, supported by anchored expectations and central bank credibility built over the past several tightening cycles.
- Emerging markets and developing economies: Higher exposure to commodity price swings and currency volatility, with less fiscal room to cushion the impact.
- Commodity importers specifically: The most vulnerable group, since energy and food price spikes hit their trade balances and domestic prices simultaneously.
- Commodity exporters: Some insulation from energy costs, though currency appreciation can create its own price distortions.
For analysts who want to see exactly where that pressure concentrates by country, Fiatmap’s inflation rankings break down headline rates across 128 countries, and the interactive inflation map makes the regional divergence visually obvious in a way a single global average never can.
U.S. Inflation Outlook 2026: FOMC Medians, CBO, and the Fed’s Path
The Federal Reserve’s own June 17 projection materials give the most granular read on U.S. inflation outlook 2026 available to the public. FOMC participants submit individual PCE and core PCE forecasts for the coming years, and the Fed publishes both the median and a 70% confidence interval around it. That interval is the part most retail coverage skips, and it is the part that actually matters for risk assessment: a wide band means the median is a best guess, not a promise.
The Congressional Budget Office offers an independent cross-check. CBO projects PCE inflation slowing slightly from 2025 to 2026, a trajectory that broadly agrees with the direction the Fed is signaling, even if the exact decimal points differ. When three independent institutional processes, the Fed, the CBO, and outside forecasters, all point the same direction, that convergence itself is a signal worth weighing more heavily than any single number.
The Philadelphia Fed’s Q2 Survey of Professional Forecasters adds a market-adjacent perspective that runs slightly hotter than the official institutions. The SPF panel raised its short-run CPI and PCE expectations for 2026 and increased the probability it assigns to core PCE landing at or above 3% for the year. That is a meaningfully different tail-risk read than the Fed’s own median implies, and it is worth building into any scenario model rather than discarding as noise.
Three plausible policy paths map onto distinct inflation outcomes for the rest of 2026:
- Hold steady. The Fed keeps rates unchanged through most of the year, betting that the current disinflation trend continues without additional tightening. Inflation likely tracks close to the FOMC median, with core PCE drifting toward the Fed’s 2% inflation target over a longer horizon.
- Modest tightening. One or two additional rate moves in response to persistent core stickiness or a wage acceleration. This scenario pulls inflation outcomes toward the lower end of the FOMC’s confidence band, at some cost to growth.
- Surprise tightening. A sharper policy response triggered by an energy shock or a break higher in the SPF’s tail-risk scenario. This is the lowest-probability path but the one with the largest market impact if it materializes, since it would arrive as a surprise rather than a telegraphed move.
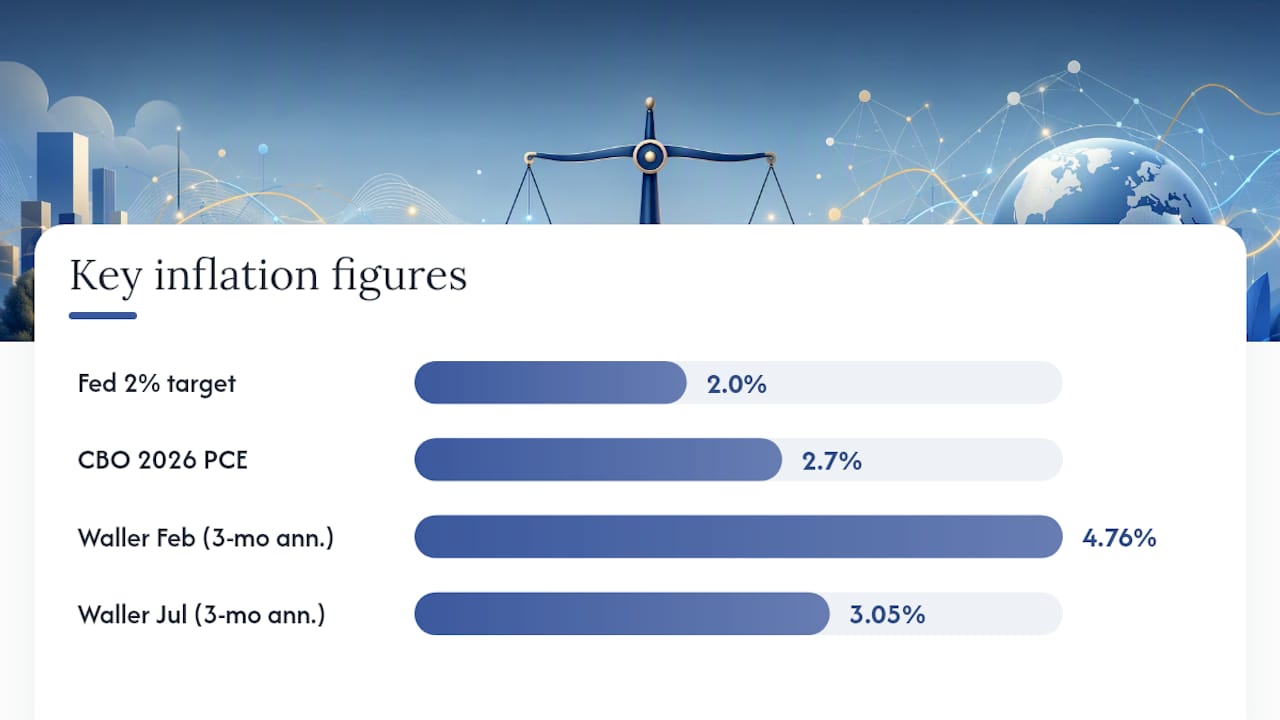
The single number analysts should anchor on: CBO’s 2.7% PCE projection for 2026 sits close to the middle of the range implied by Fed and SPF inputs, making it a reasonable working baseline for models that need one number rather than three competing ones.
Governor Christopher Waller’s September speech adds a useful technical wrinkle here: three-month annualized core inflation fell from 4.76% in February 2026 to 3.05% by July, a much sharper deceleration than the 12-month figures show. Waller specifically flagged measurement quirks around nonmarket services pricing as part of that swing, a reminder that even official gauges carry methodological noise worth understanding before treating any single monthly print as decisive.
Key Drivers and Risks Shaping the 2026 Inflation Trajectory
Every inflation forecast is really a bet on which risks dominate. For 2026, the upside and downside cases are unusually well-matched, which is exactly why the confidence bands around institutional projections are as wide as they are.
Upside risks (the ones that push inflation higher than the baseline):
- Commodity and energy shocks. The Middle East conflict remains the most visible flashpoint, but any supply disruption in oil, natural gas, or key agricultural exports transmits quickly into headline numbers.
- Wage growth outpacing productivity. When compensation rises faster than output per worker, businesses pass the difference through to prices, particularly in labor-intensive services.
- Tariff escalation. New or expanded tariffs raise input costs for importers and often trigger retaliatory measures, compounding the effect across supply chains.
Downside risks (the ones that could pull inflation below the baseline):
- AI-driven productivity gains. San Francisco Fed commentary points to productivity improvements tied to AI adoption as a genuine moderating force, though the magnitude remains uncertain.
- Demand slowdown. If consumer spending cools faster than expected, whether from labor market softening or accumulated rate effects, disinflation could resume ahead of schedule.
For analysts tracking which scenario is winning in real time, a short monitoring checklist works better than waiting for quarterly revisions:
- Three-month annualized core inflation (more sensitive to turning points than 12-month averages).
- Wage growth relative to productivity trends.
- Commodity price indices, especially energy.
- New tariff announcements or trade policy shifts.
- Fed communications and dot-plot revisions at each FOMC meeting.
Pro Tip: Three-month annualized readings react to turning points much faster than 12-month figures, but they are noisier month to month. Track both side by side. A three-month figure that diverges sharply from the 12-month trend is an early signal worth investigating, not a reason to abandon the baseline forecast outright.
How Reliable Are 2026 Inflation Forecasts? Reading the Confidence Ranges
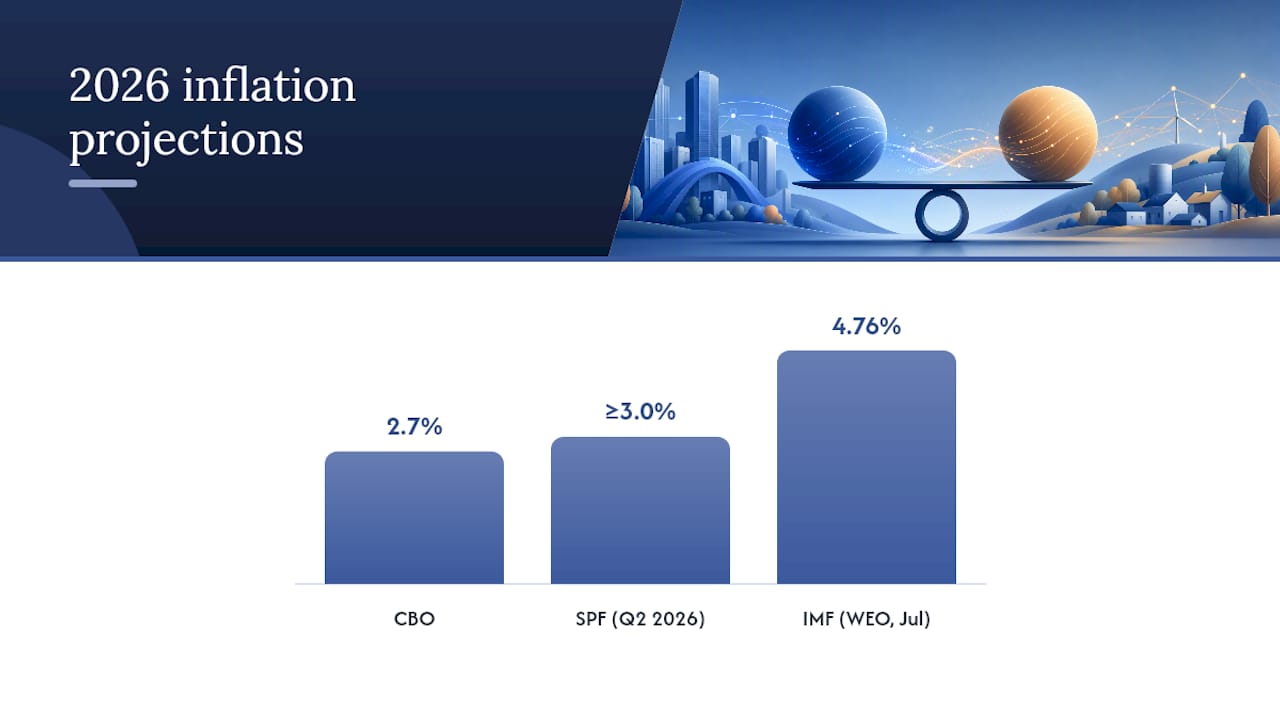
Four institutions, four slightly different numbers. Putting the IMF, Fed, CBO, and SPF projections side by side is the fastest way to see where consensus actually exists versus where it merely looks that way.
| Source | Metric | 2026 Projection |
|---|---|---|
| IMF (July WEO update) | Global headline inflation | 4.76% |
| Federal Reserve (FOMC, June 17 median) | PCE / core PCE | Published as point medians with 70% confidence bands (see Fed materials) |
| CBO | PCE inflation | 2.7% |
| SPF (Q2 2026) | Short-run CPI/PCE, elevated vs. Fed median | Higher probability assigned to core PCE ≥ 3.0% |
The gap between CBO’s 2.7% and the SPF’s tilt toward 3.0%+ is the single most useful number in this entire outlook, because it quantifies exactly how much disagreement exists among credentialed forecasters watching the same economy.
The Fed’s fan-chart methodology is built around 70% confidence intervals, meaning seven times out of ten, the actual outcome should fall within the published range if the Fed’s model assumptions hold. That is a much more honest framing than a single median number, and it is also frequently ignored by financial media that report only the point estimate.
Converting those intervals into usable scenario probabilities is a practical skill, not just an academic exercise. A reasonable working approach treats the distribution as roughly symmetric around the median for planning purposes, while checking the Fed’s own commentary for documented skew. Fan charts often carry asymmetric risk tilts, meaning the upside and downside tails are not mirror images of each other. When the Fed or IMF flags an asymmetric risk (more upside than downside, or vice versa), that skew should shift your scenario weighting, not just your point estimate.
Three numbers, three scenarios, one defensible framework.
What the 2026 Outlook Means for Portfolio Positioning
Translating institutional medians into portfolio decisions is where most inflation commentary stops short. It shouldn’t.
Fixed income deserves the first look. TIPS and other real-yield instruments are worth stress-testing against each of the three policy scenarios described earlier, since breakevens tend to widen fastest under the surprise-tightening case rather than the modest-tightening one. Understanding the real interest rate embedded in current bond pricing is a useful starting point before running those scenarios.
Equities carry a more sector-specific story. Companies with pricing power, the ability to pass input costs through without losing volume, hold up better under the upside risk case built around commodity shocks and tariff escalation. Import-heavy retailers and manufacturers with thin margins are the more exposed group. Running a simple earnings sensitivity test, applying each of the three inflation scenarios to input costs and revenue growth assumptions, surfaces which holdings are genuinely margin-fragile versus merely correlated with market sentiment.
Real assets and commodities function as the most direct hedge against the upside risk case specifically. Energy-linked commodities and select property exposures tend to respond fastest to the geopolitical and tariff risks flagged earlier. The trigger point for adding this exposure isn’t a single data release. It’s a pattern: three-month annualized core inflation breaking above trend alongside a commodity index move, confirmed by at least one Fed communication acknowledging the shift.
A workable stress-test framework doesn’t need to be complicated:
- Scenario A (hold, most likely): Baseline case, inflation tracks the CBO/Fed median cluster.
- Scenario B (modest tightening, moderate probability): Inflation pulled toward the lower end of the Fed’s confidence band.
- Scenario C (surprise tightening, lowest probability but highest impact): Triggered by an energy shock or SPF-style tail outcome, with the sharpest market repercussions.
Pro Tip: Assign rough probability weights to each scenario, run your portfolio’s expected return under all three, and check whether your current positioning is implicitly betting on Scenario A alone. Most portfolios are, and that is usually where the real risk hides.
For a cross-country view of how real yields and debt dynamics interact with these scenarios, the debt per person rankings offer useful context on which economies carry the least fiscal cushion if an upside scenario materializes.
How This Forecast Was Built
This outlook synthesizes four primary sources: the IMF’s World Economic Outlook and its July update, the Federal Reserve’s FOMC projection materials, the CBO’s Budget and Economic Outlook, and the Philadelphia Fed’s Survey of Professional Forecasters. Each institution defines its horizon slightly differently, some report year-average inflation, others emphasize Q4/Q4 changes, so the numbers above are presented with their original framing rather than force-fit into a single convention.
Fan-chart intervals, where published, are treated as genuine uncertainty ranges rather than decoration.
A few practical notes worth keeping in view:
- Every figure in this article traces back to an official institutional source, not an aggregator or secondhand summary.
- Fiatmap’s dataset sources inflation, mortgage rate, and macroeconomic data exclusively from official statistics across 128 countries, which is why it pairs well with institutional forecasts like these for cross-country modeling work.
- All forecasts here are probabilistic by nature. Treat every number as a median with a real range around it, not a guarantee.
Fiscal Policy’s Growing Weight on the 2026 Inflation Picture
Government spending is not a background variable in this outlook. It is one of the more direct levers on demand-side price pressure, particularly in economies running elevated deficits alongside near-full employment. When fiscal expansion coincides with a central bank that is already cautious about cutting rates, the combination can offset some of the disinflation that would otherwise come from softer private demand.
Any material deviation from those assumptions, a larger stimulus package, an unexpected spending cut, ripples directly into the inflation forecast built on top of them. That is part of why CBO revises its outlook regularly rather than treating any single projection as fixed.
For emerging market and developing economies, the fiscal dynamic looks different. Many of these governments have less room to run expansionary policy without triggering currency or bond market stress, which is part of why the IMF flags them as disproportionately exposed to 2026’s inflation uptick. Fiscal tightening in response to that vulnerability can itself become a drag on growth, creating a difficult tradeoff between price stability and economic momentum that advanced economies generally do not face to the same degree.
Supply Chains and the Bottlenecks That Could Reshape the Outlook
Supply chains have mostly normalized since the extreme disruptions of the early 2020s, but normalization is not the same as immunity. Shipping routes remain sensitive to geopolitical flashpoints, and the Middle East conflict cited in the IMF’s July update is a live example of how quickly a regional disruption can raise transport costs and, from there, retail prices.
Tariff policy compounds this risk. When new tariffs land on top of an already-adjusting supply chain, the effect isn’t just a one-time price bump. Businesses often restructure sourcing relationships in response, and that restructuring carries its own transitional costs that show up in prices for months afterward.
Semiconductor and critical-input supply remains a specific watch point for analysts modeling manufacturing-sector inflation. Concentration risk in a handful of production regions means a single disruption, whether from trade policy, natural disaster, or geopolitical tension, can propagate through electronics, automotive, and industrial pricing simultaneously. That kind of bottleneck rarely shows up in an aggregate inflation number until it’s already underway, which is why sector-level tracking matters more than headline CPI alone for anyone modeling supply-side risk specifically.
What Higher Inflation Actually Means for Household Budgets
Institutional medians translate into something more immediate at the household level: whether a paycheck stretches further or less far than it did the year before. If wage growth lags inflation instead, households absorb a quiet erosion in living standards even without a single dramatic price spike.
That scenario would put more pressure on categories where consumers have the least flexibility, energy, housing, and food, since these categories carry the heaviest weight in lower-income household budgets specifically.
Regional divergence shows up at the consumer level as well. Households in emerging market and developing economies face a tougher version of this same dynamic: higher exposure to imported energy and food costs, combined with currencies that often depreciate under inflationary pressure, compounding the squeeze in ways advanced-economy consumers typically avoid. Comparing purchasing power and price levels across countries makes that gap concrete rather than abstract.
Where 2026 Fits in the Longer Inflation Story
Context matters here. The inflation surge of 2021 to 2023 pushed many economies to multidecade highs, driven by pandemic-era supply disruptions, fiscal stimulus, and a sharp demand rebound. What followed was one of the more coordinated global disinflation episodes in recent memory, as central banks raised rates in near-unison and supply chains gradually normalized.
The IMF’s own framing, with inflation resuming its decline to 3.9% in 2027, treats 2026 as a temporary detour caused primarily by energy price and geopolitical pressures rather than a structural shift back toward the elevated readings of the early 2020s.
For U.S. inflation specifically, the arc looks similar but smoother. Core PCE has been gradually approaching the Fed’s 2% inflation target for several years, and the current forecasts, CBO’s 2.7%, the Fed’s median, the SPF’s slightly hotter read, all describe a landing zone closer to target than the peak years, even if none of them call it “done” outright. Understanding core inflation as distinct from headline figures is essential here, since core measures strip out the volatile energy and food components driving much of the 2026 global uptick.
What Analysts Should Actually Do With This Outlook
The highest-probability outcome here isn’t dramatic: a modest global uptick in 2026 driven by energy and geopolitics, followed by resumed disinflation in 2027, with U.S. The biggest tail risk is not a new one. It’s the same Middle East and commodity exposure that’s been flagged for two years running, finally showing up in the numbers.
What I’d push analysts to do differently is stop treating institutional medians as forecasts and start treating them as the center of a range you need to model yourself. Pull country-level inflation data, cross-reference it against debt and real-rate exposure, and build your own scenario weights rather than borrowing someone else’s point estimate. Fiatmap’s country rankings and downloadable datasets exist specifically for that kind of work, where you need comparable, officially sourced figures across dozens of economies rather than a single aggregated number. If your model needs bespoke country combinations or export formats, that’s exactly the gap the underlying dataset is built to fill.
— Torstein
Build Your Own Inflation Scenarios With Fiatmap’s Dataset
Running the three-scenario framework above requires more than one number from one country, and that’s precisely the gap Fiatmap’s Global Money Dataset fills. It pulls inflation rates, mortgage benchmarks, and over 35 macroeconomic metrics from official statistics across 128 countries, so you’re never stitching together numbers from a dozen inconsistent sources with different base years and methodologies.

For analysts building cross-country dashboards, the practical workflow is straightforward: export the relevant series as CSV or JSON directly into your existing models, pull country-level inflation trends from the inflation rankings to spot where regional divergence is sharpest, and drop embeddable widgets into internal reports so stakeholders see live figures instead of static snapshots that age out within a quarter. Every dataset traces back to official government and central bank statistics, which matters when a client or committee asks where a number actually came from. Head to the data page to download the full dataset and start building your 2026 scenario models today.
Primary Sources Worth Reading Directly
- IMF World Economic Outlook update: the fullest detail on global inflation and growth projections, including the regional breakdowns behind the headline numbers.
- Federal Reserve FOMC projection materials: the source for U.S. medians and the 70% confidence intervals discussed throughout this piece.
- CBO Budget and Economic Outlook: the independent U.S. PCE projection and its underlying fiscal assumptions.
- Philadelphia Fed Survey of Professional Forecasters: short-run medians and the probability weighting behind the elevated core PCE tail case.
This article is general information, not a substitute for advice from a qualified financial advisor. Consult a qualified financial professional about your own circumstances before acting on anything here.
Sources
- July 2026 World Economic Outlook Update — IMF (PDF)
- The Fed — June 17, 2026: FOMC projections materials
- Second Quarter 2026 Survey of Professional Forecasters — Philadelphia Fed
- The Budget and Economic Outlook: 2026 to 2036 — Congressional Budget Office
Recommended
The figures on this site are collected from official statistics and each carries its own source and date — see /sources and the dataset. Where this article states a number, the country and ranking pages are what it should agree with.