Monetary Policy Transmission for Economists: Models, ID, Global Data
2026-09-12
Monetary policy transmission is the process by which a central bank’s rate decisions travel through financial markets to change spending, output, and inflation. A central bank moves its policy rate, and that shift ripples through borrowing costs, asset prices, and exchange rates, and the resulting change in household and business behavior shows up in the real economy. The effects are rarely instant. Across advanced economies, the peak impact on output and inflation tends to occur after a delay of about one to two years, and the size of the response depends heavily on which channel does the heavy lifting.
TL;DR:
- The speed and strength of monetary policy transmission depend heavily on the country’s financial structure, especially the dominance of variable-rate or fixed-rate mortgages.
- Asset prices and wealth effects can significantly amplify or dampen the impact of rate hikes, especially through changes in housing and stock market valuations.
- The exchange-rate channel plays a crucial role mainly in smaller, open economies, influencing inflation through currency appreciation or depreciation.
- Empirical evidence shows the peak impact on output and inflation typically occurs between 12 and 24 months after a policy change.
- Central bank communication and forward guidance can influence financial conditions faster than actual rate adjustments, shaping expectations well before the move occurs.
Table of Contents
- What Is the Two-Stage Model of Monetary Policy Transmission?
- What Are the Main Channels of Monetary Policy Transmission?
- How Long Does It Take for Monetary Policy to Affect the Economy?
- Does Central Bank Communication Change Financial Conditions Before Rates Move?
- How Do Quantitative Easing and Forward Guidance Compare to Rate Changes?
- Why Do Economic Models Disagree on Transmission Strength?
- What Does the Empirical Research Say About Transmission Effects?
- What Fiatmap’s Cross-Country Data Reveals About Transmission Strength
- What Should Researchers and Policymakers Watch Going Forward?
- Where to Read More on Monetary Policy Transmission
- Sources
- FAQ
What Is the Two-Stage Model of Monetary Policy Transmission?
Central banks tend to describe transmission in two stages, and that framing is worth holding onto because almost every disagreement about “how fast does this work” or “how big is the effect” traces back to one stage or the other.
Stage one is implementation. A central bank sets a policy rate, adjusts reserve conditions, or conducts open-market operations, and that action pushes on short-term money-market rates almost immediately. Banks reprice deposits and loans, bond yields adjust, and currency markets react within days, sometimes hours. This is the mechanical, plumbing-level part of the story.
Stage two is behavioral. Once financial conditions shift, households and firms decide whether to borrow, spend, invest, or hold off. A homeowner refinancing, a firm delaying a factory expansion, an exporter recalculating margins after a currency move. This is where lags creep in, because people don’t rewrite their spending plans the moment a rate announcement crosses the wire.
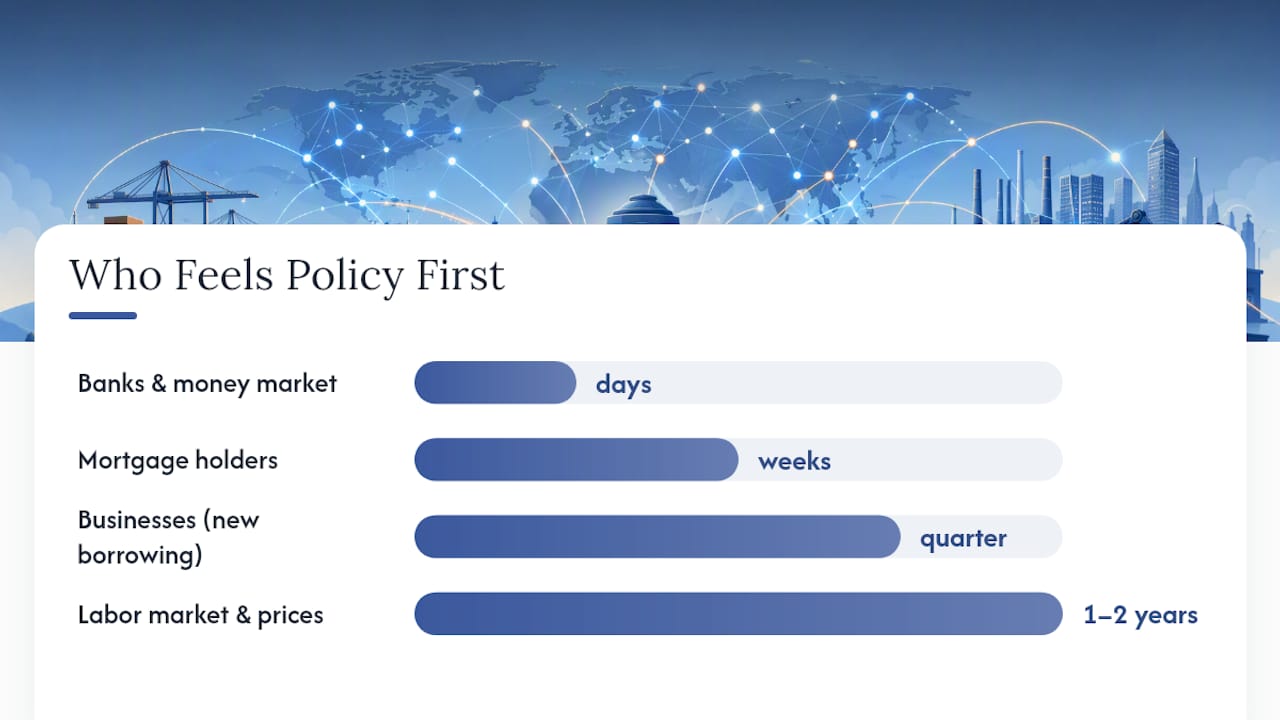
The Reserve Bank of Australia’s explainer frames it exactly this way: policy changes first hit market interest rates, then those changes work through saving, investment, and spending decisions before finally showing up in aggregate demand and inflation. Who feels stage one first?
- Banks and money-market participants, within days
- Mortgage holders on variable or soon-to-reset loans, within weeks
- Businesses evaluating new borrowing, within a quarter
- The broader labor market and consumer prices, over the following one to two years
What Are the Main Channels of Monetary Policy Transmission?
This is where the mechanism gets interesting, because “interest rates go up” doesn’t hit the economy through one pipe. It hits through several, running in parallel, at different speeds, with different strength depending on the country and the moment.
The interest-rate channel is the most direct. A policy rate hike lifts short-term rates, and depending on how the yield curve reacts, longer-term rates for mortgages and corporate bonds often follow. The pass-through is not one-to-one. Long rates reflect expected future policy plus a term premium, so a hike that markets already expected moves long rates far less than one that surprises everyone. Fiatmap’s lending rate rankings show just how differently this pass-through plays out. Some banking systems reprice loans almost mechanically off the policy rate; others show sluggish, sticky adjustment for months.
The asset-price and wealth channel works through housing and equities. Higher rates lower the present value of future cash flows, which tends to depress home and stock prices. Households with more wealth tied up in these assets typically pull back spending when values fall, and the reverse holds when rates come down. Collateral effects amplify this: falling home values make it harder to borrow against a house, which compounds the pullback.
The exchange-rate channel matters most in smaller, more open economies. A rate hike that outpaces peers tends to attract capital and appreciate the currency, which lowers import prices, dampens net exports, and directly pulls down inflation. The European Central Bank’s transmission schematic lists this alongside asset prices and bank lending as one of the core links between money-market rates and demand. Readers weighing currency exposure across countries can compare how much a shift in currency depreciation pressure typically feeds into local prices.
Credit channels cover two related mechanisms: the bank-lending channel, where tighter policy squeezes bank funding and forces lenders to cut back credit supply and tighten standards, and the balance-sheet channel, where higher rates weaken borrower net worth and collateral value, making banks less willing to lend to marginal borrowers even at the same rate. Fiatmap’s bank spread map is a useful way to see this variation directly. Wider spreads generally mean weaker or slower pass-through from the policy rate to what businesses actually pay.
The cash-flow channel is the one most often missed in textbook treatments, and it has real distributional bite. Indebted households on variable-rate mortgages see monthly payments jump immediately after a hike, cutting into disposable income and spending. Net savers see the opposite: higher deposit rates boost their income. The net effect on aggregate spending depends on how many households sit on each side of that ledger, which varies enormously by country depending on mortgage structure and homeownership rates.
Pro Tip: When comparing transmission strength across countries, check the ratio of variable-rate to fixed-rate mortgages first. A country dominated by short fixed terms or floating rates (like the UK or Australia) sees the cash-flow channel bite fast; a country dominated by 30-year fixed loans (like the US) sees it bite slowly, if at all, until refinancing cycles turn over.
There’s also a risk-taking channel, subtler but real: prolonged low rates can push investors and banks toward riskier assets in search of yield, while tightening can suddenly reprice that risk appetite and tighten financial conditions well beyond what the rate move alone would suggest.
How Long Does It Take for Monetary Policy to Affect the Economy?
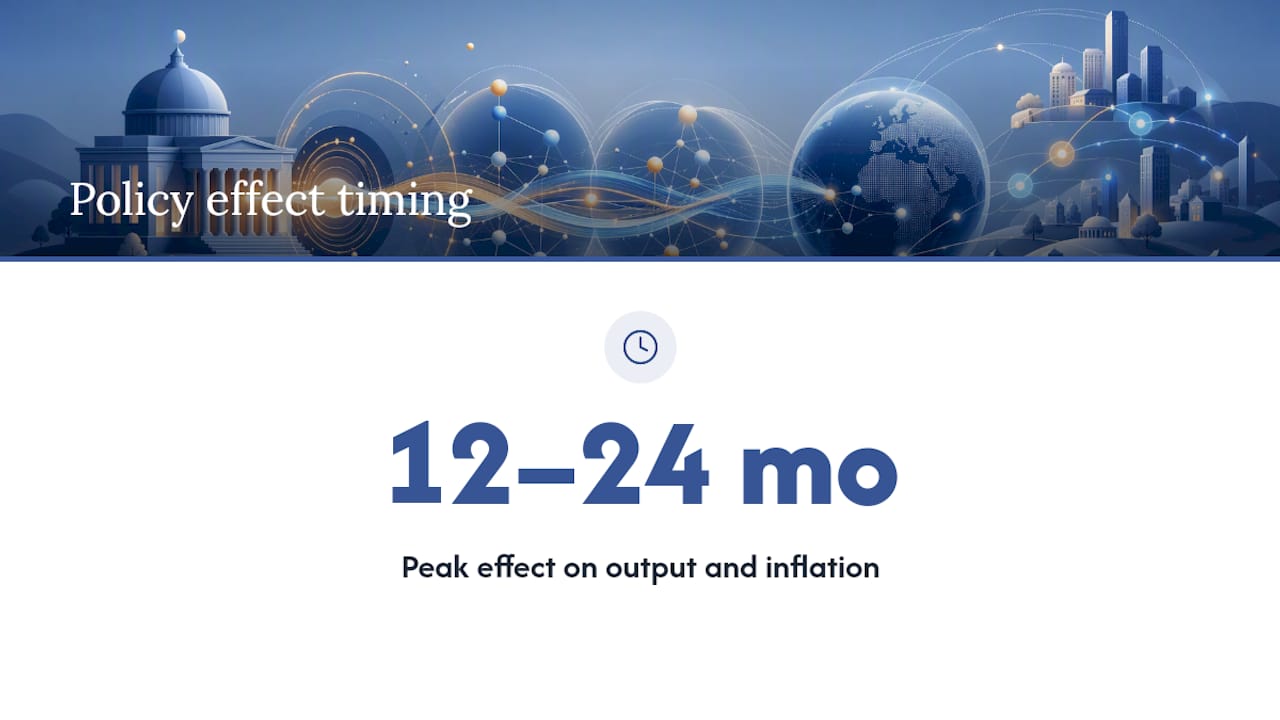
The honest answer is that nobody gets a fixed number, but the range is fairly consistent across studies. Effects on output and inflation typically peak about one to two years after a policy change, according to the Bank of Canada’s explainer on how monetary policy works.
Statistic callout: Central bank research consistently places the peak effect of a policy-rate change on output and inflation at roughly 12 to 24 months out, not immediately, and not within a single quarter.
Why the spread? A few structural factors drive it. The share of variable versus fixed-rate debt changes how fast the cash-flow channel bites. The starting level of interest rates matters too. A hike from near zero often reshapes expectations more violently than the same-sized hike from an already-elevated rate. And how open an economy is to trade and capital flows determines how much of the load the exchange-rate channel carries versus domestic credit conditions.
Economists reach for a few standard tools to estimate these lags. Vector autoregressions (VARs) trace how a rate shock propagates through a system of macro variables over time. High-frequency identification isolates the market reaction in a narrow window around a policy announcement to strip out confounding noise. Structural and semi-structural models embed theoretical assumptions about how households and firms behave, which lets researchers simulate counterfactuals that pure data can’t provide on their own.
Does Central Bank Communication Change Financial Conditions Before Rates Move?
Communication is not a footnote to policy. It is a channel in its own right, and often a faster one than the rate change itself.
- Forward guidance about the likely future path of rates can move long-term yields well before any actual rate change takes effect, because markets and bond pricing look ahead, not just at today’s setting.
- Firms setting wages and prices, and households negotiating contracts, factor in expected future inflation, so credible guidance shapes those decisions ahead of the data catching up.
- IMF commentary on the role of inflation expectations stresses that anchoring expectations reduces the uncertainty around how far pass-through will go, which is exactly what makes a credible central bank more powerful than an unpredictable one holding the same policy rate.
- Credibility itself is the asset here. Two central banks can announce identical rate paths and get different market reactions, because one has a longer track record of following through and the other doesn’t.
A well-anchored inflation target does a lot of quiet work in this story. It gives households and markets a reference point, so a single rate decision doesn’t have to do all the persuading on its own.
How Do Quantitative Easing and Forward Guidance Compare to Rate Changes?
When the policy rate hits its effective floor, central banks reach for unconventional tools, and it’s worth being clear about how these differ mechanically from a standard rate move.
- Large-scale asset purchases (LSAPs), often called quantitative easing, work by compressing term premia and pushing investors to rebalance portfolios toward riskier assets, which lowers long-term yields even when the short-term policy rate can’t move any further.
- Credit easing and targeted facilities step in when specific markets stop functioning, buying or backstopping particular asset classes to unclog the plumbing rather than trying to move the whole yield curve.
- Reviewing how a central bank balance sheet expands during these programs helps explain why LSAPs show up on the asset side of the ledger rather than in the policy-rate setting itself.
- On sheer size of effect, conventional policy-rate changes still come out on top. Recent high-frequency identification work using NBER working paper w31603 separately estimates the impact of federal funds rate changes, forward guidance, and LSAPs, and finds rate changes carry the largest punch, with guidance next and LSAPs third.
That ordering matters for anyone trying to judge how much stimulus or restraint a given announcement actually represents. A guidance shift and a matching LSAP program are not free substitutes for a rate move of equivalent headline size.
Why Do Economic Models Disagree on Transmission Strength?
Ask three macroeconomists how strong the credit channel is in a given country and you may get three different numbers, and that’s not sloppiness. It reflects real structural differences the models are built to capture.
- DSGE models (dynamic stochastic general equilibrium) impose tight theoretical structure and are good for policy counterfactuals, but they can flatten heterogeneity across households into a single representative agent.
- Semi-structural models blend theory with more flexible, data-driven relationships, trading some internal consistency for closer fit to observed data.
- HANK models (heterogeneous-agent New Keynesian) explicitly track differences across households, indebted versus net savers, liquidity-constrained versus not, which makes them far better suited to capturing the cash-flow channel’s distributional punch.
The RBA’s own bulletin work comparing its MARTIN and DINGO models shows this in practice: the two models assign different weight to the exchange-rate channel versus the cash-flow channel, even when analyzing the same policy move in the same economy. Structural drivers behind these gaps include the slope of the Phillips curve (how much inflation responds to slack), the depth of financial frictions, how sticky prices and wages are, and how well capitalized the banking sector is heading into a tightening cycle.
The practical implication: nobody should lean on a single model’s transmission estimate as gospel. Running the same policy question through a DSGE model, a semi-structural model, and a HANK-style model, and looking at where they agree and where they diverge, tells you more than any single number can.
What Does the Empirical Research Say About Transmission Effects?
Empirical work has gotten sharper about isolating cause from correlation, mostly by exploiting narrow windows around policy surprises rather than relying on broad historical correlations that might just reflect the state of the economy driving the rate decision, not the other way around.
- High-frequency identification consistently ranks federal funds rate surprises as the largest driver of financial conditions, ahead of forward guidance, with LSAPs contributing the smallest marginal effect per dollar deployed, per the NBER’s w31603 findings.
- Cross-country research from the San Francisco Fed finds that unexpected tightening can leave a lasting scar. In some settings, a surprise rate increase corresponds with lower output that persists for roughly a decade, likely working through depressed investment and productivity.
- Identification challenges remain real: rates and output move together for many reasons, and separating the causal effect of policy from the central bank simply reacting to a slowing economy requires the kind of narrow-window, surprise-based methods this generation of research leans on.
What Fiatmap’s Cross-Country Data Reveals About Transmission Strength
Transmission is not uniform across borders, and that’s precisely where cross-country data earns its keep. A rate hike in a country with mostly floating-rate mortgages hits household cash flow within a single billing cycle. The same hike in a country dominated by long fixed terms barely registers for years.
Fiatmap’s datasets map these differences directly. Mortgage rate comparisons reveal cash-flow channel exposure at a glance. Bank spread data shows where the credit channel runs wide and sluggish versus tight and responsive. Inflation and price-level data help gauge how much room the exchange-rate channel has to do the work. The mortgage calculator and the interactive bank spread map let you line these figures up side by side across the 128 countries Fiatmap tracks, rather than hunting through separate national statistical releases one at a time.
What Should Researchers and Policymakers Watch Going Forward?
If there’s one thing the current empirical literature makes clear, it’s that no single indicator tells the whole transmission story. Credit spreads deserve constant attention, since they widen well before headline data catches up to a tightening in financial conditions. Housing price momentum is a close second, given how much of the wealth channel runs through it. Survey measures of household inflation expectations round out the trio, because anchored expectations are what let a central bank move less to achieve the same effect.
The bigger research gap is household-level data. Aggregate models miss how unevenly the cash-flow channel actually lands, which is exactly the gap HANK-style frameworks were built to close. Combining that granular view with high-frequency empirical identification, rather than trusting either alone, is the most credible path toward understanding how a rate decision actually moves through an economy.
— Torstein
Where to Read More on Monetary Policy Transmission
- RBA explainer: canonical two-stage framing.
- ECB transmission page: full channel schematic.
- Bank of Canada note: lag evidence.
- San Francisco Fed letter: long-run effects.
- NBER working paper w31603: tool-by-tool identification.
Compare current mortgage rates by country or explore the full Fiatmap dataset, free and sourced entirely from official statistics, to see how these channels play out where you live or invest.
This article is general information, not a substitute for advice from a qualified financial advisor. Consult a qualified financial professional about your own circumstances before acting on anything here.
Sources
- The Transmission of Monetary Policy | Explainer | Education | RBA
- Transmission mechanism of monetary policy - European Central Bank
- Understanding how monetary policy works - Bank of Canada
- NBER working paper w31603 (separate identification of rate, guidance, and LSAP effects)
- Does monetary policy have long-run effects? - San Francisco Fed
FAQ
What Is Monetary Policy Transmission?
It’s the process by which a central bank’s rate decisions alter market interest rates, asset prices, credit conditions, and exchange rates, which then change household and business spending and ultimately shift output and inflation.
What Are the Main Steps in the Transmission Mechanism?
Most central banks describe it in two broad stages: the policy rate first passes through to market interest rates and financial conditions, then those changed conditions alter saving, investment, and spending decisions that feed into aggregate demand and inflation.
What Is the Fed’s Monetary Policy Transmission Mechanism?
The Federal Reserve’s mechanism runs through the same core channels used elsewhere: interest rates, asset prices, exchange rates, and bank credit, with research using high-frequency identification finding that federal funds rate changes carry the largest effect, ahead of forward guidance and asset purchases.
How Long Does the Transmission Mechanism Take to Work?
Empirical research generally finds that the effects of a policy change on output and inflation peak between 12 and 24 months after the initial move, not immediately.
Which Channel of Monetary Policy Transmission Is Strongest?
There’s no universal answer since it depends on the country’s financial structure, but conventional interest-rate changes tend to produce the largest overall effect, with the credit and cash-flow channels often dominating in economies with high household debt and variable-rate borrowing.
Recommended
The figures on this site are collected from official statistics and each carries its own source and date — see /sources and the dataset. Where this article states a number, the country and ranking pages are what it should agree with.